false--04-30Q3202100014871980.6400014871982020-05-012021-01-31xbrli:shares00014871982021-03-11iso4217:USD00014871982021-01-3100014871982020-04-300001487198aspu:ComputerEquipmentAndHardwareMember2021-01-310001487198aspu:ComputerEquipmentAndHardwareMember2020-04-300001487198us-gaap:FurnitureAndFixturesMember2021-01-310001487198us-gaap:FurnitureAndFixturesMember2020-04-300001487198us-gaap:LeaseholdImprovementsMember2021-01-310001487198us-gaap:LeaseholdImprovementsMember2020-04-300001487198aspu:InstructionalEquipmentMember2021-01-310001487198aspu:InstructionalEquipmentMember2020-04-300001487198us-gaap:ComputerSoftwareIntangibleAssetMember2021-01-310001487198us-gaap:ComputerSoftwareIntangibleAssetMember2020-04-300001487198us-gaap:ConstructionInProgressMember2021-01-310001487198us-gaap:ConstructionInProgressMember2020-04-300001487198aspu:IntangibleAssetsOtherThanCoursewareAndAccreditationMember2021-01-310001487198aspu:IntangibleAssetsOtherThanCoursewareAndAccreditationMember2020-04-300001487198aspu:CoursewareAndAccreditationMember2021-01-310001487198aspu:CoursewareAndAccreditationMember2020-04-30iso4217:USDxbrli:shares00014871982020-11-012021-01-3100014871982019-11-012020-01-3100014871982019-05-012020-01-310001487198us-gaap:CommonStockMember2020-10-310001487198us-gaap:AdditionalPaidInCapitalMember2020-10-310001487198us-gaap:TreasuryStockMember2020-10-310001487198us-gaap:RetainedEarningsMember2020-10-3100014871982020-10-310001487198us-gaap:AdditionalPaidInCapitalMember2020-11-012021-01-310001487198us-gaap:CommonStockMember2020-11-012021-01-310001487198us-gaap:TreasuryStockMember2020-11-012021-01-310001487198us-gaap:RetainedEarningsMember2020-11-012021-01-310001487198us-gaap:CommonStockMember2021-01-310001487198us-gaap:AdditionalPaidInCapitalMember2021-01-310001487198us-gaap:TreasuryStockMember2021-01-310001487198us-gaap:RetainedEarningsMember2021-01-310001487198us-gaap:CommonStockMember2019-10-310001487198us-gaap:AdditionalPaidInCapitalMember2019-10-310001487198us-gaap:TreasuryStockMember2019-10-310001487198us-gaap:RetainedEarningsMember2019-10-3100014871982019-10-310001487198us-gaap:AdditionalPaidInCapitalMember2019-11-012020-01-310001487198us-gaap:CommonStockMember2019-11-012020-01-310001487198us-gaap:RetainedEarningsMember2019-11-012020-01-310001487198us-gaap:CommonStockMember2020-01-310001487198us-gaap:AdditionalPaidInCapitalMember2020-01-310001487198us-gaap:TreasuryStockMember2020-01-310001487198us-gaap:RetainedEarningsMember2020-01-3100014871982020-01-310001487198us-gaap:CommonStockMember2020-04-300001487198us-gaap:AdditionalPaidInCapitalMember2020-04-300001487198us-gaap:TreasuryStockMember2020-04-300001487198us-gaap:RetainedEarningsMember2020-04-300001487198us-gaap:AdditionalPaidInCapitalMember2020-05-012021-01-310001487198us-gaap:CommonStockMember2020-05-012021-01-310001487198us-gaap:TreasuryStockMember2020-05-012021-01-310001487198us-gaap:RetainedEarningsMember2020-05-012021-01-310001487198us-gaap:CommonStockMember2019-04-300001487198us-gaap:AdditionalPaidInCapitalMember2019-04-300001487198us-gaap:TreasuryStockMember2019-04-300001487198us-gaap:RetainedEarningsMember2019-04-3000014871982019-04-300001487198us-gaap:AdditionalPaidInCapitalMember2019-05-012020-01-310001487198us-gaap:CommonStockMember2019-05-012020-01-310001487198us-gaap:RetainedEarningsMember2019-05-012020-01-31aspu:subsidiaryaspu:studentxbrli:pure0001487198aspu:RegisteredNursesRNsMember2021-01-310001487198aspu:BSNPreLicensureProgramMember2021-01-310001487198aspu:AspenNursingMember2020-11-012021-01-310001487198aspu:MSNFNPMember2020-11-012021-01-310001487198srt:ScenarioForecastMemberaspu:AspenNursingMember2021-02-012021-04-300001487198srt:ScenarioForecastMemberaspu:MSNFNPMember2021-02-012021-04-300001487198srt:MinimumMembersrt:ScenarioForecastMember2021-02-012021-04-300001487198srt:MaximumMembersrt:ScenarioForecastMember2021-02-012021-04-30aspu:agreement00014871982019-03-012019-03-310001487198aspu:LoanAgreementOneMember2019-03-310001487198aspu:LoanAgreementTwoMember2019-03-310001487198aspu:LeonAndTobyCoopermanFamilyFoundationMemberaspu:LoanAgreementsMember2019-03-012019-03-310001487198aspu:LoanAgreementsMember2019-03-012019-03-3100014871982020-01-222020-01-220001487198us-gaap:RevolvingCreditFacilityMember2018-11-052018-11-050001487198us-gaap:RevolvingCreditFacilityMember2018-11-050001487198aspu:CollateralPledgedAspenUniversityLetterOfCreditMember2021-01-310001487198aspu:CollateralPledgedBankLetterOfCreditMember2021-01-310001487198aspu:SecuredCreditLineMember2021-01-310001487198aspu:UnbilledEducationalServicesMember2021-01-310001487198aspu:CollateralPledgedBankLetterOfCreditMember2020-08-310001487198aspu:CollateralPledgedAspenUniversityLetterOfCreditMember2020-04-300001487198aspu:CollateralPledgedBankLetterOfCreditMember2020-04-300001487198aspu:ReceiptOfTitleIVFundsMember2020-04-300001487198aspu:UnbilledEducationalServicesMember2020-04-300001487198aspu:ComputerEquipmentAndHardwareMember2020-05-012021-01-310001487198us-gaap:ComputerSoftwareIntangibleAssetMember2020-05-012021-01-310001487198aspu:InstructionalEquipmentMember2020-05-012021-01-310001487198us-gaap:FurnitureAndFixturesMember2020-05-012021-01-310001487198srt:MaximumMemberus-gaap:LeaseholdImprovementsMember2020-05-012021-01-310001487198aspu:CoursewareAndAccreditationMember2020-05-012021-01-3100014871982019-05-010001487198us-gaap:RestrictedStockUnitsRSUMember2021-01-310001487198us-gaap:RestrictedStockUnitsRSUMember2020-01-310001487198us-gaap:WarrantMember2021-01-310001487198us-gaap:WarrantMember2020-01-310001487198aspu:UnvestedRestrictedStockMember2021-01-310001487198aspu:UnvestedRestrictedStockMember2020-01-310001487198us-gaap:ConvertibleDebtMember2020-04-300001487198us-gaap:ConvertibleDebtMember2019-05-012020-01-31aspu:segment0001487198aspu:EducacionSignificativaLLCMember2020-11-012021-01-310001487198aspu:EducacionSignificativaLLCMember2020-05-012021-01-310001487198aspu:EducacionSignificativaLLCMember2019-11-012020-01-310001487198aspu:EducacionSignificativaLLCMember2019-05-012020-01-310001487198aspu:EducacionSignificativaLLCMember2021-01-310001487198aspu:EducacionSignificativaLLCMember2020-04-300001487198aspu:CoursewareMember2020-05-012021-01-310001487198aspu:CoursewareMember2021-01-310001487198aspu:CoursewareMember2020-04-300001487198aspu:AccreditationMember2021-01-310001487198aspu:AccreditationMember2020-04-300001487198aspu:CoursewareAndAccreditationMember2020-11-012021-01-310001487198aspu:CoursewareAndAccreditationMember2019-11-012020-01-310001487198aspu:CoursewareAndAccreditationMember2019-05-012020-01-310001487198aspu:ConvertibleNotesMemberus-gaap:ConvertibleNotesPayableMember2020-01-22aspu:lenderaspu:note0001487198aspu:ConvertibleNotesMemberus-gaap:RevolvingCreditFacilityMember2018-11-050001487198aspu:ConvertibleNotesMemberus-gaap:RevolvingCreditFacilityMember2020-01-222020-01-220001487198aspu:ConvertibleNotesMemberus-gaap:ConvertibleNotesPayableMember2020-01-222020-01-22aspu:day0001487198aspu:ConvertibleNotesMemberus-gaap:ConvertibleNotesPayableMember2020-09-140001487198aspu:ConvertibleNotesMemberus-gaap:ConvertibleNotesPayableMember2020-09-142020-09-140001487198us-gaap:CommonStockMemberaspu:ConvertibleNotesMemberus-gaap:ConvertibleNotesPayableMember2020-09-142020-09-140001487198aspu:ConvertibleNotesMemberus-gaap:ConvertibleNotesPayableMember2020-08-012020-10-310001487198aspu:CreditFacilityAgreementMemberus-gaap:RevolvingCreditFacilityMember2018-11-050001487198aspu:CreditFacilityAgreementMemberus-gaap:RevolvingCreditFacilityMember2018-11-052018-11-050001487198aspu:CreditFacilityAgreementMemberus-gaap:RevolvingCreditFacilityMember2021-01-310001487198aspu:CreditFacilityAgreementMemberus-gaap:RevolvingCreditFacilityMember2020-04-3000014871982019-03-062019-03-060001487198aspu:LeonAndTobyCoopermanFamilyFoundationMemberaspu:LoanAgreementsMember2019-03-062019-03-060001487198us-gaap:RevolvingCreditFacilityMember2019-03-060001487198aspu:LeonAndTobyCoopermanFamilyFoundationMemberaspu:LoanAgreementsMember2019-03-060001487198aspu:LoanAgreementsMember2019-03-062019-03-060001487198aspu:LoanAgreementsMemberus-gaap:WarrantMember2019-03-060001487198aspu:LoanAgreementsMemberus-gaap:WarrantMember2019-03-062019-03-060001487198aspu:CoopermanWarrantsMemberus-gaap:WarrantMember2020-06-052020-06-050001487198us-gaap:LoansPayableMember2020-01-222020-01-220001487198aspu:EquityDistributionAgreementMember2020-08-310001487198aspu:EquityDistributionAgreementMember2020-05-012021-01-310001487198aspu:EquityDistributionAgreementMember2020-08-312020-08-310001487198us-gaap:CommonStockMemberaspu:FormerDirectorMember2020-11-012021-01-3100014871982020-08-012020-10-310001487198us-gaap:CommonStockMember2020-05-012020-07-3100014871982020-05-012020-07-310001487198us-gaap:RestrictedStockMember2021-01-310001487198us-gaap:RestrictedStockMember2020-01-310001487198us-gaap:RestrictedStockUnitsRSUMember2020-04-300001487198us-gaap:RestrictedStockUnitsRSUMember2020-05-012021-01-310001487198aspu:BoardOfDirectorsMemberus-gaap:RestrictedStockUnitsRSUMember2020-11-012021-01-310001487198us-gaap:RestrictedStockUnitsRSUMember2020-11-012021-01-310001487198srt:MinimumMemberus-gaap:RestrictedStockUnitsRSUMember2020-05-012021-01-310001487198srt:MaximumMemberus-gaap:RestrictedStockUnitsRSUMember2020-05-012021-01-310001487198us-gaap:ShareBasedCompensationAwardTrancheThreeMemberus-gaap:RestrictedStockUnitsRSUMember2021-01-310001487198us-gaap:ShareBasedCompensationAwardTrancheThreeMemberus-gaap:RestrictedStockUnitsRSUMember2020-02-042020-02-040001487198us-gaap:RestrictedStockUnitsRSUMember2020-02-042020-02-040001487198us-gaap:RestrictedStockUnitsRSUMember2020-06-182020-06-180001487198us-gaap:ShareBasedCompensationAwardTrancheOneMemberus-gaap:RestrictedStockUnitsRSUMember2020-02-042020-02-040001487198us-gaap:ShareBasedCompensationAwardTrancheTwoMemberus-gaap:RestrictedStockUnitsRSUMember2020-02-042020-02-040001487198us-gaap:CommonStockMember2020-02-040001487198us-gaap:RestrictedStockUnitsRSUMember2020-02-040001487198us-gaap:ShareBasedCompensationAwardTrancheOneMemberus-gaap:RestrictedStockUnitsRSUMember2020-08-312020-08-310001487198us-gaap:ShareBasedCompensationAwardTrancheTwoMemberus-gaap:RestrictedStockUnitsRSUMember2020-09-022020-09-0200014871982020-09-020001487198us-gaap:SubsequentEventMemberaspu:FormerCFOMemberus-gaap:RestrictedStockUnitsRSUMember2021-02-262021-02-260001487198us-gaap:WarrantMember2020-04-300001487198us-gaap:WarrantMember2020-04-302020-04-300001487198us-gaap:WarrantMember2020-05-012021-01-310001487198us-gaap:WarrantMember2021-01-310001487198us-gaap:WarrantMember2020-10-312020-10-310001487198us-gaap:WarrantMemberaspu:ShareBasedCompensationSharesAuthorizedUnderStockOptionPlansExercisePriceRangeNineMember2020-05-012021-01-310001487198us-gaap:WarrantMemberaspu:ShareBasedCompensationSharesAuthorizedUnderStockOptionPlansExercisePriceRangeNineMember2021-01-310001487198aspu:ShareBasedCompensationSharesAuthorizedUnderStockOptionPlansExercisePriceRangeSixZeroMemberus-gaap:WarrantMember2020-05-012021-01-310001487198aspu:ShareBasedCompensationSharesAuthorizedUnderStockOptionPlansExercisePriceRangeSixZeroMemberus-gaap:WarrantMember2021-01-310001487198aspu:ShareBasedCompensationSharesAuthorizedUnderStockOptionPlansExercisePriceRangeElevenMemberus-gaap:WarrantMember2020-05-012021-01-310001487198aspu:ShareBasedCompensationSharesAuthorizedUnderStockOptionPlansExercisePriceRangeElevenMemberus-gaap:WarrantMember2021-01-310001487198aspu:CoopermanWarrantsMember2020-06-052020-06-050001487198aspu:CoopermanWarrantsMemberaspu:CreditFacilityAgreementMemberus-gaap:RevolvingCreditFacilityMember2018-11-050001487198aspu:CoopermanWarrantsMemberaspu:CreditFacilityAgreementMemberus-gaap:RevolvingCreditFacilityMember2020-06-050001487198aspu:CoopermanWarrantsMemberaspu:LoanAgreementsMember2019-03-062019-03-060001487198aspu:CoopermanWarrantsMemberaspu:LoanAgreementsMember2020-06-052020-06-050001487198aspu:CoopermanWarrantsMember2020-06-080001487198aspu:CoopermanWarrantsMember2020-06-082020-06-080001487198aspu:EquityIncentivePlanMember2012-03-130001487198aspu:A2018EquityIncentivePlanMember2018-12-130001487198aspu:A2018EquityIncentivePlanMember2019-12-300001487198aspu:A2018EquityIncentivePlanMember2020-12-200001487198aspu:A2018EquityIncentivePlanMember2020-12-210001487198aspu:EquityIncentivePlanMember2021-01-310001487198aspu:EquityIncentivePlanMember2020-01-310001487198aspu:StockOptionGrantsToEmployeesAndDirectorsMember2020-05-012021-01-310001487198aspu:StockOptionGrantsToEmployeesAndDirectorsMember2020-11-012021-01-310001487198aspu:StockOptionGrantsToEmployeesAndDirectorsMember2020-04-300001487198aspu:StockOptionGrantsToEmployeesAndDirectorsMember2020-04-302020-04-300001487198aspu:StockOptionGrantsToEmployeesAndDirectorsMember2021-01-310001487198aspu:StockOptionGrantsToEmployeesAndDirectorsMember2021-01-312021-01-310001487198aspu:ShareBasedCompensationSharesAuthorizedUnderStockOptionPlansExercisePriceRangeOneMember2020-05-012021-01-310001487198aspu:ShareBasedCompensationSharesAuthorizedUnderStockOptionPlansExercisePriceRangeOneMember2021-01-310001487198aspu:ShareBasedCompensationSharesAuthorizedUnderStockOptionPlansExercisePriceRangeTwoMember2020-05-012021-01-310001487198aspu:ShareBasedCompensationSharesAuthorizedUnderStockOptionPlansExercisePriceRangeTwoMember2021-01-310001487198aspu:ShareBasedCompensationSharesAuthorizedUnderStockOptionPlansExercisePriceRangeThreeMember2020-05-012021-01-310001487198aspu:ShareBasedCompensationSharesAuthorizedUnderStockOptionPlansExercisePriceRangeThreeMember2021-01-310001487198aspu:ShareBasedCompensationSharesAuthorizedUnderStockOptionPlansExercisePriceRangeFourMember2020-05-012021-01-310001487198aspu:ShareBasedCompensationSharesAuthorizedUnderStockOptionPlansExercisePriceRangeFourMember2021-01-310001487198aspu:ShareBasedCompensationSharesAuthorizedUnderStockOptionPlansExercisePriceRangeFiveMember2020-05-012021-01-310001487198aspu:ShareBasedCompensationSharesAuthorizedUnderStockOptionPlansExercisePriceRangeFiveMember2021-01-310001487198aspu:ShareBasedCompensationSharesAuthorizedUnderStockOptionPlansExercisePriceRangeSixMember2020-05-012021-01-310001487198aspu:ShareBasedCompensationSharesAuthorizedUnderStockOptionPlansExercisePriceRangeSixMember2021-01-310001487198aspu:ShareBasedCompensationSharesAuthorizedUnderStockOptionPlansExercisePriceRangeSevenMember2020-05-012021-01-310001487198aspu:ShareBasedCompensationSharesAuthorizedUnderStockOptionPlansExercisePriceRangeSevenMember2021-01-310001487198us-gaap:EmployeeStockOptionMember2020-11-012021-01-310001487198us-gaap:RestrictedStockMember2020-11-012021-01-310001487198us-gaap:EmployeeStockOptionMember2020-05-012021-01-310001487198us-gaap:RestrictedStockMember2020-05-012021-01-310001487198us-gaap:EmployeeStockOptionMember2021-01-3100014871982020-10-162020-10-160001487198aspu:TuitionRevenueMember2020-11-012021-01-310001487198aspu:TuitionRevenueMember2019-11-012020-01-310001487198aspu:TuitionRevenueMember2020-05-012021-01-310001487198aspu:TuitionRevenueMember2019-05-012020-01-310001487198aspu:CourseFeeRevenueMember2020-11-012021-01-310001487198aspu:CourseFeeRevenueMember2019-11-012020-01-310001487198aspu:CourseFeeRevenueMember2020-05-012021-01-310001487198aspu:CourseFeeRevenueMember2019-05-012020-01-310001487198aspu:BookFeeRevenueMember2020-11-012021-01-310001487198aspu:BookFeeRevenueMember2019-11-012020-01-310001487198aspu:BookFeeRevenueMember2020-05-012021-01-310001487198aspu:BookFeeRevenueMember2019-05-012020-01-310001487198aspu:ExamFeeRevenueMember2020-11-012021-01-310001487198aspu:ExamFeeRevenueMember2019-11-012020-01-310001487198aspu:ExamFeeRevenueMember2020-05-012021-01-310001487198aspu:ExamFeeRevenueMember2019-05-012020-01-310001487198aspu:ServiceFeeRevenueMember2020-11-012021-01-310001487198aspu:ServiceFeeRevenueMember2019-11-012020-01-310001487198aspu:ServiceFeeRevenueMember2020-05-012021-01-310001487198aspu:ServiceFeeRevenueMember2019-05-012020-01-310001487198us-gaap:NonUsMemberus-gaap:SalesRevenueNetMember2020-11-012021-01-310001487198us-gaap:NonUsMemberus-gaap:SalesRevenueNetMember2020-05-012021-01-310001487198us-gaap:NonUsMemberus-gaap:SalesRevenueNetMember2019-11-012020-01-310001487198us-gaap:NonUsMemberus-gaap:SalesRevenueNetMember2019-05-012020-01-31utr:sqft0001487198aspu:TampaFloridaMember2021-01-310001487198aspu:PhoenixArizonaMember2021-01-3100014871982013-02-110001487198aspu:HemgMember2015-09-290001487198aspu:HemgMember2015-10-150001487198aspu:HemgMember2019-02-082019-02-080001487198aspu:HemgMember2020-06-020001487198aspu:TitleIVProgramsAspenUniversityMemberus-gaap:SalesRevenueNetMember2019-05-012020-04-300001487198us-gaap:SalesRevenueNetMemberaspu:TitleIVProgramsUnitedStatesUniversityMember2019-05-012020-04-300001487198us-gaap:LetterOfCreditMember2020-09-280001487198us-gaap:LetterOfCreditMember2020-08-310001487198aspu:CollateralPledgedBankLetterOfCreditMember2020-12-310001487198us-gaap:SubsequentEventMemberaspu:FormerCFOMember2021-02-260001487198us-gaap:SubsequentEventMemberaspu:FormerCFOMemberaspu:StockOptionGrantsToEmployeesAndDirectorsMember2021-02-26
UNITED STATES
SECURITIES AND EXCHANGE COMMISSION
Washington, D.C. 20549
FORM 10-Q
| | | | | |
| ☑ | QUARTERLY REPORT PURSUANT TO SECTION 13 OR 15(d) OF THE SECURITIES EXCHANGE ACT OF 1934 |
For the quarterly period ended January 31, 2021
or
| | | | | |
| ☐ | TRANSITION REPORT PURSUANT TO SECTION 13 OR 15(d) OF THE SECURITIES EXCHANGE ACT OF 1934 |
| For the transition period from ___________ to ___________ |
Commission file number 001-38175
ASPEN GROUP, INC.
(Exact Name of Registrant as Specified in Its Charter)
| | | | | | | | | | | | | | |
| Delaware | | 27-1933597 | |
| State or Other Jurisdiction of Incorporation or Organization | | I.R.S. Employer Identification No. | |
| | | | |
| 276 Fifth Avenue, Suite 505, New York, New York | | 10001 | |
| Address of Principal Executive Offices | | Zip Code | |
(480) 407-7365
(Registrant’s telephone number, including area code)
Securities registered pursuant to Section 12(b) of the Act:
| | | | | | | | |
| Title of each class | Trading Symbol(s) | Name of each exchange on which registered |
| Common Stock, par value $0.001 | ASPU | The Nasdaq Stock Market (The Nasdaq Global Market) |
Indicate by check mark whether the registrant (1) has filed all reports required to be filed by Section 13 or 15(d) of the Securities Exchange Act of 1934 during the preceding 12 months (or for such shorter period that the registrant was required to file such reports), and (2) has been subject to such filing requirements for the past 90 days. Yes þ No ¨
Indicate by check mark whether the registrant has submitted electronically every Interactive Data File required to be submitted pursuant to Rule 405 of Regulation S-T (§ 232.405 of this chapter) during the preceding 12 months (or for such shorter period that the registrant was required to submit such files). Yes þ No ¨
Indicate by check mark whether the registrant is a large accelerated filer, an accelerated filer, a non-accelerated filer, smaller reporting company, or an emerging growth company. See the definitions of “large accelerated filer,” “accelerated filer,” “smaller reporting company,” and “emerging growth company” in Rule 12b-2 of the Exchange Act.
| | | | | | | | |
| Large accelerated filer ¨ | Accelerated filer ¨ |
| Non-accelerated filer ☑ | Smaller reporting company ☑ |
| Emerging growth company ☐ | |
If an emerging growth company, indicate by check mark if the registrant has elected not to use the extended transition period for complying with any new or revised financial accounting standards provided pursuant to Section 13(a) of the Exchange Act. ☐
Indicate by check mark whether the registrant is a shell company (as defined in Rule 12b-2 of the Act). Yes ☐ No þ
| | | | | | | | |
| Class | | Outstanding as of March 11, 2021 |
| Common Stock, $0.001 par value per share | | 24,950,423 shares |
TABLE OF CONTENTS
PART I. FINANCIAL INFORMATION
ITEM 1. FINANCIAL STATEMENTS
ASPEN GROUP, INC. AND SUBSIDIARIES
CONSOLIDATED BALANCE SHEETS
| | | | | | | | | | | |
| January 31, 2021 | | April 30, 2020 |
| (Unaudited) | | |
| Assets | | | |
| Current assets: | | | |
| Cash and cash equivalents | $ | 9,987,382 | | | $ | 14,350,554 | |
| Restricted cash | 3,395,068 | | | 3,556,211 | |
Accounts receivable, net of allowance of $2,924,887 and $1,758,920, respectively | 15,832,552 | | | 14,326,791 | |
| Prepaid expenses | 1,209,197 | | | 941,671 | |
| Other receivables | — | | | 23,097 | |
| Other current assets | 1,378,173 | | | 173,090 | |
| Total current assets | 31,802,372 | | | 33,371,414 | |
| | | |
| Property and equipment: | | | |
| Computer equipment and hardware | 799,826 | | | 649,927 | |
| Furniture and fixtures | 1,013,103 | | | 1,007,099 | |
| Leasehold improvements | 920,736 | | | 867,024 | |
| Instructional equipment | 315,993 | | | 301,842 | |
| Software | 7,944,693 | | | 6,162,770 | |
| Construction in progress | 907,780 | | | — | |
| 11,902,131 | | | 8,988,662 | |
| Less accumulated depreciation and amortization | (4,355,308) | | | (2,841,019) | |
| Total property and equipment, net | 7,546,823 | | | 6,147,643 | |
| Goodwill | 5,011,432 | | | 5,011,432 | |
| Intangible assets, net | 7,900,000 | | | 7,900,000 | |
| Courseware, net | 110,069 | | | 111,457 | |
Accounts receivable, net of allowance of $625,963 and $625,963, respectively | 45,329 | | | 45,329 | |
| Long term contractual accounts receivable | 9,986,613 | | | 6,701,136 | |
| Debt issue cost, net | 26,389 | | | 182,418 | |
| Operating lease right of use assets, net | 11,114,766 | | | 6,412,851 | |
| Deposits and other assets | 500,470 | | | 355,831 | |
| Total assets | $ | 74,044,263 | | | $ | 66,239,511 | |
(Continued)
The accompanying condensed notes are an integral part of these unaudited consolidated financial statements.
ASPEN GROUP, INC. AND SUBSIDIARIES
CONSOLIDATED BALANCE SHEETS (CONTINUED)
| | | | | | | | | | | |
| January 31, 2021 | | April 30, 2020 |
| (Unaudited) | | |
| Liabilities and Stockholders’ Equity | | | |
| Current liabilities: | | | |
| Accounts payable | $ | 1,155,977 | | | $ | 1,505,859 | |
| Accrued expenses | 2,293,515 | | | 537,413 | |
| Deferred revenue | 5,600,371 | | | 3,712,994 | |
| Due to students | 2,243,690 | | | 2,371,844 | |
| Operating lease obligations, current portion | 2,102,209 | | | 1,683,252 | |
| Other current liabilities | 307,677 | | | 545,711 | |
| Total current liabilities | 13,703,439 | | | 10,357,073 | |
| | | |
Convertible notes, net of discount of $0 and $1,550,854, respectively | — | | | 8,449,146 | |
| Operating lease obligations, less current portion | 9,968,293 | | | 5,685,335 | |
| Total liabilities | 23,671,732 | | | 24,491,554 | |
| | | |
| Commitments and contingencies – see Note 10 | | | |
| | | |
| Stockholders’ equity: | | | |
Preferred stock, $0.001 par value; 1,000,000 shares authorized, | | | |
0 issued and 0 outstanding at January 31, 2021 and April 30, 2020 | — | | | — | |
Common stock, $0.001 par value; 40,000,000 shares authorized, | | | |
24,939,673 issued and 24,784,187 outstanding at January 31, 2021 | | | |
21,770,520 issued and 21,753,853 outstanding at April 30, 2020 | 24,940 | | | 21,771 | |
| Additional paid-in capital | 108,003,022 | | | 89,505,216 | |
Treasury stock (155,486 and 16,667 shares at January 31, 2021 and April 30, 2020, respectively) | (1,817,414) | | | (70,000) | |
| Accumulated deficit | (55,838,017) | | | (47,709,030) | |
| Total stockholders’ equity | 50,372,531 | | | 41,747,957 | |
| Total liabilities and stockholders’ equity | $ | 74,044,263 | | | $ | 66,239,511 | |
The accompanying condensed notes are an integral part of these unaudited consolidated financial statements.
ASPEN GROUP, INC. AND SUBSIDIARIES
CONSOLIDATED STATEMENTS OF OPERATIONS
(Unaudited)
| | | | | | | | | | | | | | | | | | | | | | | |
| Three Months Ended January 31, | | Nine Months Ended January 31, |
| 2021 | | 2020 | | 2021 | | 2020 |
| Revenues | $ | 16,624,837 | | | $ | 12,537,940 | | | $ | 48,761,444 | | | $ | 34,981,887 | |
| | | | | | | |
| Operating expenses: | | | | | | | |
| Cost of revenues (exclusive of depreciation and amortization shown separately below) | 7,559,951 | | | 5,163,007 | | | 20,732,254 | | | 13,704,121 | |
| General and administrative | 10,644,438 | | | 8,625,041 | | | 30,723,349 | | | 22,613,242 | |
| Bad debt expense | 670,000 | | | 2,547 | | | 1,702,000 | | | 651,205 | |
| Depreciation and amortization | 535,273 | | | 475,393 | | | 1,552,254 | | | 1,710,192 | |
| Total operating expenses | 19,409,662 | | | 14,265,988 | | | 54,709,857 | | | 38,678,760 | |
| | | | | | | |
| Operating loss | (2,784,825) | | | (1,728,048) | | | (5,948,413) | | | (3,696,873) | |
| | | | | | | |
| Other income (expense): | | | | | | | |
| Interest expense | (33,539) | | | (571,958) | | | (2,018,664) | | | (1,424,607) | |
| Other income (expense), net | 13,558 | | | 34,117 | | | (116,820) | | | 189,486 | |
| Total other expense, net | (19,981) | | | (537,841) | | | (2,135,484) | | | (1,235,121) | |
| | | | | | | |
| Loss before income taxes | (2,804,806) | | | (2,265,889) | | | (8,083,897) | | | (4,931,994) | |
| | | | | | | |
| Income tax expense | 10,460 | | | 15,163 | | | 45,090 | | | 62,508 | |
| | | | | | | |
| Net loss | $ | (2,815,266) | | | $ | (2,281,052) | | | $ | (8,128,987) | | | $ | (4,994,502) | |
| | | | | | | |
| Net loss per share - basic and diluted | $ | (0.11) | | | $ | (0.12) | | | $ | (0.35) | | | $ | (0.26) | |
| | | | | | | |
| Weighted average number of common stock outstanding - basic and diluted | 24,544,334 | | | 19,420,987 | | | 23,354,036 | | | 19,046,558 | |
The accompanying condensed notes are an integral part of these unaudited consolidated financial statements.
ASPEN GROUP, INC. AND SUBSIDIARIES
CONSOLIDATED STATEMENTS OF CHANGES IN STOCKHOLDERS’ EQUITY
Three Months Ended January 31, 2021 and 2020
(Unaudited)
| | | | | | | | | | | | | | | | | | | | | | | | | | | | | | | | | | | |
| Common Stock | | Additional
Paid-In
Capital | | Treasury
Stock | | Accumulated
Deficit | | Total
Stockholders’
Equity |
| Shares | | Amount | | | | |
| Balance at October 31, 2020 | 24,416,539 | | | $ | 24,417 | | | $ | 105,092,551 | | | $ | — | | | $ | (53,022,751) | | | $ | 52,094,217 | |
| Stock-based compensation | — | | | — | | | 701,170 | | | — | | | — | | | 701,170 | |
| Common stock issued for stock options exercised for cash | 447,134 | | | 447 | | | 2,180,352 | | | (1,817,414) | | | — | | | 363,385 | |
| Common stock issued for vested restricted stock units | 74,000 | | | 74 | | | (74) | | | — | | | — | | | — | |
| Common stock issued for services | 2,000 | | | 2 | | | 19,898 | | | — | | | — | | | 19,900 | |
| Amortization of warrant based cost | — | | | — | | | 9,125 | | | — | | | — | | | 9,125 | |
| Net loss | — | | | — | | | — | | | — | | | (2,815,266) | | | (2,815,266) | |
| Balance at January 31, 2021 | 24,939,673 | | | $ | 24,940 | | | $ | 108,003,022 | | | $ | (1,817,414) | | | $ | (55,838,017) | | | $ | 50,372,531 | |
| | | | | | | | | | | |
| Common Stock | | Additional
Paid-In
Capital | | Treasury
Stock | | Accumulated
Deficit | | Total
Stockholders’
Equity |
| Shares | | Amount | | | | |
| Balance at October 31, 2019 | 19,142,316 | | | $ | 19,142 | | | $ | 69,781,363 | | | $ | (70,000) | | | $ | (44,763,415) | | | $ | 24,967,090 | |
| Stock-based compensation | — | | | — | | | 737,820 | | | — | | | — | | | 737,820 | |
| Common stock issued for cashless stock options exercised | 8,352 | | | 9 | | | (9) | | | — | | | — | | | — | |
| Common stock issued for stock options exercised for cash | 121,407 | | | 121 | | | 530,547 | | | — | | | — | | | 530,668 | |
| Amortization of warrant based cost | — | | | — | | | 9,125 | | | — | | | — | | | 9,125 | |
| Amortization of restricted stock issued for services | — | | | — | | | 24,398 | | | — | | | — | | | 24,398 | |
| Restricted stock issued for services, subject to vesting | 40,000 | | | 40 | | | (40) | | | — | | | — | | | — | |
Common stock issued for equity raise, net of underwriter costs of $1,222,371 | 2,415,000 | | | 2,415 | | | 16,042,464 | | | — | | | — | | | 16,044,879 | |
| Other offering costs | — | | | — | | | (51,282) | | | — | | | — | | | (51,282) | |
| Beneficial conversion feature on convertible debt | — | | | — | | | 1,692,309 | | | — | | | — | | | 1,692,309 | |
| Common stock short swing reclamation | — | | | — | | | 5,433 | | | — | | | — | | | 5,433 | |
| Net loss | — | | | — | | | — | | | — | | | (2,281,052) | | | (2,281,052) | |
| Balance at January 31, 2020 | 21,727,075 | | | $ | 21,727 | | | $ | 88,772,128 | | | $ | (70,000) | | | $ | (47,044,467) | | | $ | 41,679,388 | |
The accompanying condensed notes are an integral part of these unaudited consolidated financial statements.
ASPEN GROUP, INC. AND SUBSIDIARIES
CONSOLIDATED STATEMENTS OF CHANGES IN STOCKHOLDERS’ EQUITY (CONTINUED)
Nine months ended January 31, 2021 and 2020
(Unaudited)
| | | | | | | | | | | | | | | | | | | | | | | | | | | | | | | | | | | |
| Common Stock | | Additional
Paid-In
Capital | | Treasury
Stock | | Accumulated
Deficit | | Total
Stockholders’
Equity |
| Shares | | Amount | | | | |
| Balance at April 30, 2020 | 21,770,520 | | | $ | 21,771 | | | $ | 89,505,216 | | | $ | (70,000) | | | $ | (47,709,030) | | | $ | 41,747,957 | |
| Stock-based compensation | — | | | — | | | 3,019,828 | | | — | | | — | | | 3,019,828 | |
| Common stock issued for stock options exercised for cash | 1,364,721 | | | 1,365 | | | 4,394,749 | | | (1,817,414) | | | — | | | 2,578,700 | |
| Common stock issued for cashless stock options exercised | 22,339 | | | 22 | | | (22) | | | — | | | — | | | — | |
| Common stock issued for conversion of Convertible Notes | 1,398,602 | | | 1,399 | | | 9,998,601 | | | — | | | — | | | 10,000,000 | |
| Common stock issued for vested restricted stock units | 206,109 | | | 206 | | | (206) | | | — | | | — | | | — | |
| Common stock issued for warrants exercised for cash | 192,049 | | | 192 | | | 1,081,600 | | | — | | | — | | | 1,081,792 | |
| Common stock issued for services | 2,000 | | | 2 | | | 19,898 | | | — | | | — | | | 19,900 | |
| Modification charge for warrants exercised | — | | | — | | | 25,966 | | | — | | | — | | | 25,966 | |
| Amortization of warrant based cost | — | | | — | | | 27,375 | | | — | | | — | | | 27,375 | |
| Cancellation of treasury stock | (16,667) | | | (17) | | | (69,983) | | | 70,000 | | | — | | | — | |
| Net loss | — | | | — | | | — | | | — | | | (8,128,987) | | | (8,128,987) | |
| Balance January 31, 2021 | 24,939,673 | | | $ | 24,940 | | | $ | 108,003,022 | | | $ | (1,817,414) | | | $ | (55,838,017) | | | $ | 50,372,531 | |
| | | | | | | | | | | |
| Common Stock | | Additional
Paid-In
Capital | | Treasury
Stock | | Accumulated
Deficit | | Total
Stockholders’
Equity |
| Shares | | Amount | | | | |
| Balance at April 30, 2019 | 18,665,551 | | | $ | 18,666 | | | $ | 68,562,727 | | | $ | (70,000) | | | $ | (42,049,965) | | | $ | 26,461,428 | |
| Stock-based compensation | — | | | — | | | 1,627,304 | | | — | | | — | | | 1,627,304 | |
| Common stock issued for cashless stock options exercised | 190,559 | | | 191 | | | (191) | | | — | | | — | | | — | |
| Common stock issued for stock options exercised for cash | 234,233 | | | 234 | | | 768,147 | | | — | | | — | | | 768,381 | |
| Common stock issued for cashless warrant exercise | 76,929 | | | 77 | | | (77) | | | — | | | — | | | — | |
| Amortization of warrant based cost | — | | | — | | | 27,690 | | | — | | | — | | | 27,690 | |
| Amortization of restricted stock issued for services | — | | | — | | | 97,748 | | | — | | | — | | | 97,748 | |
| Restricted stock issued for services, subject to vesting | 144,803 | | | 144 | | | (144) | | | — | | | — | | | — | |
Common stock issued for equity raise, net of underwriter costs of $1,222,371 | 2,415,000 | | | 2,415 | | | 16,042,464 | | | — | | | — | | | 16,044,879 | |
| Other offerings costs | — | | | — | | | (51,282) | | | — | | | — | | | (51,282) | |
| Beneficial conversion feature on convertible debt | — | | | — | | | 1,692,309 | | | — | | | — | | | 1,692,309 | |
| Common stock short swing reclamation | — | | | — | | | 5,433 | | | — | | | — | | | 5,433 | |
| Net loss | — | | | — | | | — | | | — | | | (4,994,502) | | | (4,994,502) | |
| Balance at January 31, 2020 | 21,727,075 | | | $ | 21,727 | | | $ | 88,772,128 | | | $ | (70,000) | | | $ | (47,044,467) | | | $ | 41,679,388 | |
The accompanying condensed notes are an integral part of these unaudited consolidated financial statements.
ASPEN GROUP, INC. AND SUBSIDIARIES
CONSOLIDATED STATEMENTS OF CASH FLOWS
(Unaudited)
| | | | | | | | | | | |
| Nine Months Ended January 31, |
| | 2021 | | 2020 |
| Cash flows from operating activities: | | | |
| Net loss | $ | (8,128,987) | | | $ | (4,994,502) | |
| Adjustments to reconcile net loss to net cash used in operating activities: | | | |
| Bad debt expense | 1,702,000 | | | 651,205 | |
| Depreciation and amortization | 1,552,254 | | | 1,710,192 | |
| Stock-based compensation | 3,019,828 | | | 1,782,472 | |
| Amortization of warrant based cost | 27,375 | | | 27,690 | |
| Loss on asset disposition | — | | | 3,918 | |
| Amortization of debt discounts | 1,550,854 | | | 182,218 | |
| Amortization of debt issue costs | 156,029 | | | 88,825 | |
| Modification charge for warrants exercised | 25,966 | | | — | |
| Common stock issued for services | 19,900 | | | 97,748 | |
| Changes in operating assets and liabilities: | | | |
| Accounts receivable | (6,493,238) | | | (7,104,911) | |
| Prepaid expenses | (267,526) | | | (567,192) | |
| Other receivables | 23,097 | | | 395 | |
| Other current assets | (1,205,083) | | | (173,090) | |
| Deposits and other assets | (185,599) | | | 280,091 | |
| Accounts payable | (349,882) | | | (908,083) | |
| Accrued expenses | 1,756,102 | | | 426,567 | |
| Deferred rent | — | | | (17,805) | |
| Due to students | (128,154) | | | 1,137,244 | |
| Deferred revenue | 1,887,377 | | | 3,237,878 | |
| Other current liabilities | (238,032) | | | 313,875 | |
| Net cash used in operating activities | (5,275,719) | | | (3,825,265) | |
| Cash flows from investing activities: | | | |
| Purchases of courseware and accreditation | (31,330) | | | (11,001) | |
| Purchases of property and equipment | (2,877,758) | | | (1,929,878) | |
| Net cash used in investing activities | (2,909,088) | | | (1,940,879) | |
| Cash flows from financing activities: | | | |
| Proceeds from warrants exercised | 1,081,792 | | | — | |
| Proceeds from stock options exercised | 2,578,700 | | | 768,381 | |
| Proceeds from sale of common stock net of underwriter costs | — | | | 16,044,879 | |
| Disbursements for equity offering costs | — | | | (51,282) | |
| Common stock short swing reclamation | — | | | 5,433 | |
| Net cash provided by financing activities | 3,660,492 | | | 16,767,411 | |
(Continued)
The accompanying condensed notes are an integral part of these unaudited consolidated financial statements.
ASPEN GROUP, INC. AND SUBSIDIARIES
CONSOLIDATED STATEMENTS OF CASH FLOWS (CONTINUED)
(Unaudited)
| | | | | | | | | | | |
| Nine Months Ended January 31, |
| 2021 | | 2020 |
| Net (decrease) increase in cash, cash equivalents and restricted cash | $ | (4,524,315) | | | $ | 11,001,267 | |
| Cash, cash equivalents and restricted cash at beginning of period | 17,906,765 | | | 9,967,752 | |
| Cash, cash equivalents and restricted cash at end of period | $ | 13,382,450 | | | $ | 20,969,019 | |
| | | |
| Supplemental disclosure cash flow information | | | |
| Cash paid for interest | $ | 310,958 | | | $ | 979,792 | |
| Cash paid for income taxes | $ | 49,008 | | | $ | 110,307 | |
| | | |
| Supplemental disclosure of non-cash investing and financing activities | | | |
| Common stock issued for conversion of Convertible Notes | $ | 10,000,000 | | | $ | — | |
| Right-of-use lease asset offset against operating lease obligations | $ | 3,914,640 | | | $ | 7,693,268 | |
| Common stock issued for services | $ | — | | | $ | 178,447 | |
| Beneficial conversion feature on convertible debt | $ | — | | | $ | 1,692,309 | |
| | | |
| | | |
The following table provides a reconciliation of cash and cash equivalents and restricted cash reported within the accompanying consolidated balance sheet to the total amounts shown in the accompanying unaudited consolidated statements of cash flows:
| | | | | | | | | | | |
| January 31, 2021 | | January 31, 2020 |
| | | |
| Cash and cash equivalents | $ | 9,987,382 | | | $ | 20,512,808 | |
| Restricted cash | 3,395,068 | | | 456,211 | |
| Total cash, cash equivalents and restricted cash | $ | 13,382,450 | | | $ | 20,969,019 | |
The accompanying condensed notes are an integral part of these unaudited consolidated financial statements.
ASPEN GROUP, INC. AND SUBSIDIARIES
CONDENSED NOTES TO CONSOLIDATED FINANCIAL STATEMENTS
January 31, 2021
(Unaudited)
Note 1. Nature of Operations and Liquidity
Overview
Aspen Group, Inc. ("AGI") is an educational technology holding company. AGI has five subsidiaries, Aspen University Inc. ("Aspen University") organized in 1987, Aspen Nursing of Arizona, Inc. ("ANAI"), Aspen Nursing of Florida, Inc. ("ANFI"), Aspen Nursing of Texas, Inc. ("ANTI"), and United States University Inc. ("United States University" or "USU"). ANAI, ANFI and ANTI are subsidiaries of Aspen University Inc.
All references to the “Company”, “AGI”, “Aspen Group”, “we”, “our” and “us” refer to Aspen Group, Inc., unless the context otherwise indicates.
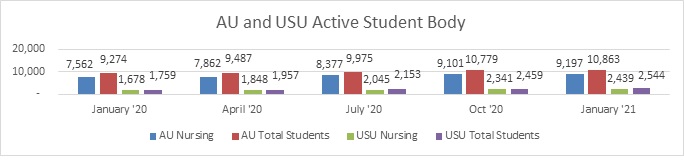
AGI leverages its education technology infrastructure and expertise to allow its two universities, Aspen University and United States University, to deliver on the vision of making college affordable again. Because we believe higher education should be a catalyst to our students’ long-term economic success, we exert financial prudence by offering affordable tuition that is one of the greatest values in higher education. AGI’s primary focus relative to future growth is to target the high growth nursing profession. As of January 31, 2021, 11,636 of 13,407 or 87% of all active students across both universities are degree-seeking nursing students. Of the 11,636 students seeking nursing degrees, 9,277 are Registered Nurses (RNs) studying to earn an advanced degree, while the remaining 2,359 nursing students are enrolled in Aspen University’s BSN Pre-Licensure program in the Phoenix, Austin and Tampa metros.
Since 1993, Aspen University has been nationally accredited by the Distance Education and Accrediting Council (“DEAC”), a national accrediting agency recognized by the United States Department of Education (the “DOE”) and Council for Higher Education Accreditation ("CHEA"). On February 25, 2019, the DEAC informed Aspen University that it had renewed its accreditation for five years through January 2024.
Since 2009, USU has been regionally accredited by WASC Senior College and University Commission. (“WSCUC”).
Both universities are qualified to participate under the Higher Education Act of 1965, as amended (HEA) and the Federal student financial assistance programs (Title IV, HEA programs). USU has a provisional certification resulting from the ownership change of control in connection with the acquisition by AGI on December 1, 2017.
Basis of Presentation
Interim Financial Statements
The interim consolidated financial statements included herein have been prepared by the Company, without audit, pursuant to the rules and regulations of the Securities and Exchange Commission (the “SEC”). In the opinion of the Company’s management, all adjustments (consisting of normal recurring adjustments and reclassifications and non-recurring adjustments) necessary to present fairly our results of operations for the three and nine months ended January 31, 2021 and 2020, our cash flows for the nine months ended January 31, 2021 and 2020, and our financial position as of January 31, 2021 have been made. The results of operations for such interim periods are not necessarily indicative of the operating results to be expected for the full year.
Certain information and disclosures normally included in the notes to the annual consolidated financial statements have been condensed or omitted from these interim consolidated financial statements. Accordingly, these interim consolidated financial statements should be read in conjunction with the consolidated financial statements and notes thereto included in our Annual Report on Form 10-K for the fiscal year ended April 30, 2020 as filed with the SEC on July 7, 2020. The April 30, 2020 consolidated balance sheet is derived from those statements.
COVID-19 Update
ASPEN GROUP, INC. AND SUBSIDIARIES
CONDENSED NOTES TO CONSOLIDATED FINANCIAL STATEMENTS
January 31, 2021
(Unaudited)
In our third fiscal quarter ending January 31, 2021, which has been historically a seasonally slower quarter given it falls during the holiday months of November and December, Aspen University saw approximately 4% less course registrations than seasonally expected in our Aspen Nursing + Other unit (which equates to approximately $110,000 of reduced revenue per month or $330,000 in the quarter relative to the Company’s forecast).
USU’s MSN-FNP program also saw a similar course start decline of approximately 4% in the quarter relative to the Company’s forecast, which equates to approximately $190,000 of reduced revenue for the quarter.
We believe COVID-19 ‘Wave Two’ was the key factor in the lower course starts than forecasted at both universities in the quarter, given that all the states in the country are now affected – not just some of the major metros. Our predominant student demographic of RNs (as of January 31, 2021, 9,277 of the Company's 13,407 total active students or 69% are RNs) has been especially overwhelmed over the past several months, so this is not unexpected.
The status and/or reasons identified by our predominantly RN student body who constitute the lower course starts over the past several months fall into four categories; 1) rescheduling of upcoming course registrations to a later date, 2) requests for temporary leave of absence, 3) requests to delay placement into preferred clinical location timed with the facility accepting new in-person students again, and 4) course or program withdrawal requests due to family emergencies, pressures at work/emotional distress and lack of time.
The Company expects the COVID ‘Wave Two’ effect to continue throughout the current fourth fiscal quarter, as we are forecasting approximately 4.5% less course registrations than seasonally expected in our Aspen Nursing + Other unit and USU’s MSN-FNP program. Consequently, in our current fourth fiscal quarter ending April 30, 2021, we are expecting year-over-year revenue growth in the range of 31% - 33% ($18.4 - $18.7 million), versus the Company’s previous forecast of 36% growth or $19.1 million.
Liquidity
At January 31, 2021, the Company had a cash and cash equivalents balance of $9,987,382 and $3,395,068 of restricted cash.
In March 2019, the Company entered into two loan agreements for a principal amount of $5 million each and received total proceeds of $10 million. In connection with the loan agreements, the Company issued 18 month senior secured promissory term notes, with the Company having the right to extend the term of the loans for an additional 12 months by paying a 1% one-time extension fee. On January 22, 2020, the term notes were exchanged for convertible notes maturing January 22, 2023. On September 14, 2020, the Convertible Notes automatically converted into shares of the Company’s common stock. (See Note 6)
On January 22, 2020, the Company closed on an underwritten public offering of common stock for net proceeds of approximately $16 million. The public offering was a condition precedent to the closing of the above refinancing. (See Note 6)
On November 5, 2018 the Company entered into a three year, $5,000,000 senior revolving credit facility. There is currently no outstanding balance under that facility. (See Note 6)
During the nine months ended January 31, 2021 the Company's net cash and restricted cash decreased by $4,524,315, which included using $5,275,719 in operating activities.
The Company has analyzed its liquidity position and believes its current resources are adequate to meet anticipated liquidity needs for the next 12 months from the issuance date of this report.
Note 2. Significant Accounting Policies
Basis of Presentation and Consolidation
The Company prepares its consolidated financial statements in accordance with U.S. generally accepted accounting principles ("GAAP").
ASPEN GROUP, INC. AND SUBSIDIARIES
CONDENSED NOTES TO CONSOLIDATED FINANCIAL STATEMENTS
January 31, 2021
(Unaudited)
The consolidated financial statements include the accounts of AGI and its wholly-owned subsidiaries. All intercompany balances and transactions have been eliminated in consolidation.
Accounting Estimates
Management of the Company is required to make certain estimates, judgments and assumptions during the preparation of its consolidated financial statements in accordance with GAAP. These estimates, judgments and assumptions impact the reported amounts of assets, liabilities, revenue and expenses and the related disclosure of contingent assets and liabilities. Actual results could differ from those estimates.
Significant estimates in the accompanying consolidated financial statements include the allowance for doubtful accounts and other receivables, the valuation of lease liabilities and the carrying value of the related right-of-use ("ROU") assets, depreciable lives of property and equipment, amortization periods and valuation of courseware, intangibles and software development costs, valuation of goodwill, valuation of loss contingencies, valuation of stock-based compensation and the valuation allowance on deferred tax assets.
Cash, Cash Equivalents, and Restricted Cash
For the purposes of the consolidated statements of cash flows, the Company considers all highly liquid investments with an original maturity of three months or less when purchased to be cash equivalents.
Restricted cash as of January 31, 2021 of $3,395,068 primarily consists of $934,125 which is collateral for letters of credit for the Aspen University and USU facility operating leases, $9,872 which is collateral for a letter of credit for USU required to be posted based on the level of Title IV funding in connection with USU's most recent Compliance Audit, and a $250,000 compensating balance under a secured credit line. Also included are funds held for students for unbilled educational services that were received from Title IV and non-Title IV programs totaling $2,201,071. As an administrator of these Title IV program funds, the Company is required to maintain and restrict these funds pursuant to the terms of the program participation agreement with the U.S. Department of Education. In August 2020, USU entered into a $379,345 letter of credit which was collateral required to be posted based on the level of Title IV funding; and subsequently in December 2020, the DOE released this existing USU letter of credit.
Restricted cash as of April 30, 2020 of $3,556,211 primarily consisted of $692,293 which is collateral for letters of credit for the Aspen University and USU facility operating leases and $255,708 which is collateral for a letter of credit issued by the bank and $71,828 which is related to USU’s receipt of Title IV funds and is required by the Department of Education ("DOE") in connection with the change of control of USU. Also included are funds held for students for unbilled educational services that were received from Title IV and non-Title IV programs totaling $2,536,382. As an administrator of these Title IV program funds, the Company is required to maintain and restrict these funds pursuant to the terms of the program participation agreement with the DOE.
Concentration of Credit Risk
The Company maintains its cash in bank and financial institution deposits that at times may exceed federally insured limits of $250,000 per financial institution. The Company has not experienced any losses in such accounts from inception through January 31, 2021. As of January 31, 2021 and April 30, 2020, the Company maintained deposits exceeding federally insured limits by approximately $12,578,734 and $16,242,603, respectively, held in two separate institutions.
Goodwill and Intangibles
Goodwill currently represents the excess of purchase price over the fair market value of assets acquired and liabilities assumed from the 2017 acquisition of USU. Goodwill has an indefinite life and is not amortized. Goodwill is tested annually for impairment or if indicators are present.
In January 2017, the Financial Accounting Standards Board issued Accounting Standards Update No. 2017-04: "Intangibles - Goodwill and Other (Topic 350)” - to simplify how an entity is required to test goodwill for impairment by eliminating Step 2
ASPEN GROUP, INC. AND SUBSIDIARIES
CONDENSED NOTES TO CONSOLIDATED FINANCIAL STATEMENTS
January 31, 2021
(Unaudited)
from the goodwill impairment test. Step 2 measures a goodwill impairment loss by comparing the implied fair value of a reporting unit’s goodwill with the carrying amount of that goodwill. This guidance is effective for interim and annual reporting periods beginning after December 15, 2019. The Company early adopted this standard effective April 30, 2018. We have selected an April 30 annual goodwill impairment test date.
When evaluating the potential impairment of goodwill, management first assess a range of qualitative factors, including but not limited to, macroeconomic conditions, industry conditions, the competitive environment, changes in the market for the Company’s products and services, regulatory and political developments, entity specific factors such as strategy and changes in key personnel, and the overall financial performance for each of the Company’s reporting units. If, after completing this assessment, it is determined that it is more likely than not that the fair value of a reporting unit is less than its carrying value, we then proceed to the quantitative impairment testing.
We compare the carrying value of the reporting unit, including goodwill, with its fair value, as determined. If the carrying value of a reporting unit exceeds its fair value, then the amount of impairment to be recognized is the amount by which the carrying amount exceeds the fair value.
When required, we arrive at our estimates of fair value using a discounted cash flow methodology which includes estimates of future cash flows to be generated by a component where the goodwill is recorded, as well as determining a discount rate to measure the present value of those anticipated cash flows. Estimating future cash flows requires significant judgment and includes making assumptions about projected growth rates, industry-specific factors, working capital requirements, weighted average cost of capital, and current and anticipated operating conditions. The use of different assumptions or estimates for future cash flows could produce different results.
Intangible assets represent both indefinite lived and definite lived assets. Accreditation and regulatory approvals, trade name and trademarks are deemed to have indefinite useful lives and accordingly are not amortized but are tested annually for impairment. Student relationships and curriculums are deemed to have definite lives and are amortized accordingly.
Fair Value Measurements
Fair value is the exchange price that would be received for an asset or paid to transfer a liability (an exit price) in the principal or most advantageous market for the asset or liability in an orderly transaction between market participants. The Company classifies assets and liabilities recorded at fair value under the fair value hierarchy based upon the observability of inputs used in valuation techniques. Observable inputs (highest level) reflect market data obtained from independent sources, while unobservable inputs (lowest level) reflect internally developed market assumptions. The fair value measurements are classified under the following hierarchy:
Level 1—Observable inputs that reflect quoted market prices (unadjusted) for identical assets and liabilities in active markets;
Level 2—Observable inputs, other than quoted market prices, that are either directly or indirectly observable in the marketplace for identical or similar assets and liabilities, quoted prices in markets that are not active, or other inputs that are observable or can be corroborated by observable market data for substantially the full term of the assets and liabilities; and
Level 3—Unobservable inputs that are supported by little or no market activity that are significant to the fair value of assets or liabilities.
The estimated fair value of certain financial instruments, including cash and cash equivalents, accounts receivable, accounts payable and accrued expenses are carried at historical cost basis, which approximates their fair values because of the short-term nature of these instruments.
Accounts Receivable and Allowance for Doubtful Accounts Receivable
ASPEN GROUP, INC. AND SUBSIDIARIES
CONDENSED NOTES TO CONSOLIDATED FINANCIAL STATEMENTS
January 31, 2021
(Unaudited)
All students are required to select both a primary and secondary payment option with respect to amounts due to AGI for tuition, fees and other expenses. As of January 31, 2021, the monthly payment plan represents approximately 61% of the payments that are made by AGI's total active students, making it the most common payment type. In instances where a student selects financial aid as the primary payment option, he or she often selects personal cash as the secondary option. If a student who has selected financial aid as his or her primary payment option withdraws prior to the end of a course but after the date that AGI’s institutional refund period has expired, the student will have incurred the obligation to pay the full cost of the course. If the withdrawal occurs before the date at which the student has earned 100% of his or her financial aid, AGI may have to return all or a portion of the Title IV funds to the DOE and the student will owe AGI all amounts incurred that are in excess of the amount of financial aid that the student earned, and that AGI is entitled to retain. In this case, AGI must collect the receivable using the student’s second payment option.
For accounts receivable from students, AGI records an allowance for doubtful accounts for estimated losses resulting from the inability, failure or refusal of its students to make required payments, which includes the recovery of financial aid funds advanced to a student for amounts in excess of the student’s cost of tuition and related fees. AGI determines the adequacy of its allowance for doubtful accounts using an allowance method based on an analysis of its historical bad debt experience, current economic trends, aging of the accounts receivable and each student’s status. AGI estimates the amounts to increase the allowance based upon the risk presented by the age of the receivables and student status. AGI writes off accounts receivable balances at the time the balances are deemed uncollectible. AGI continues to reflect accounts receivable with an offsetting allowance as long as management believes there is a reasonable possibility of collection.
For accounts receivable from primary payors other than students, AGI estimates its allowance for doubtful accounts by evaluating specific accounts where information indicates the primary payors may have an inability to meet financial obligations, such as bankruptcy proceedings and receivable amounts outstanding for an extended period beyond contractual terms. In these cases, AGI uses assumptions and judgment, based on the best available facts and circumstances, to record a specific allowance for those primary payors against amounts due to reduce the receivable to the amount expected to be collected. These specific allowances are re-evaluated and adjusted as additional information is received. The amounts calculated are analyzed to determine the total amount of the allowance. AGI may also record a general allowance as necessary.
Direct write-offs are taken in the period when AGI has exhausted its efforts to collect overdue and unpaid receivables or otherwise evaluate other circumstances that indicate that AGI should abandon such efforts. (See Note 8)
When a student signs up for the monthly payment plan, there is a contractual amount that the Company can expect to earn over the life of the student’s program. This contractual amount cannot be recorded as an accounts receivable because, the student does have the option to stop attending. As a student takes a class, revenue is earned over the class term. Some students accelerate their program, taking two or more classes every eight week period, which increases the student’s accounts receivable balance. If any portion of that balance will be paid in a period greater than 12 months, that portion is reflected as long-term accounts receivable. At January 31, 2021 and April 30, 2020, those balances were $9,986,613 and $6,701,136, respectively, which amounts are evaluated and included in the allowance analysis as discussed above. The Company has determined that the long term accounts receivable do not constitute a significant financing component as the list price, cash selling price and promised consideration are equal. Further, the interest free financing portion of the monthly payment plans are not considered significant to the contract.
Property and Equipment
Property and equipment are recorded at cost less accumulated depreciation and amortization. Depreciation and amortization is computed using the straight-line method over the estimated useful lives of the related assets per the following table.
| | | | | | | | |
| Category | | Useful Life |
| Computer equipment and hardware | | 3 years |
| Software | | 5 years |
| Instructional equipment | | 5 years |
| Furniture and fixtures | | 7 years |
| Leasehold improvements | | The lesser of 8 years or lease term |
ASPEN GROUP, INC. AND SUBSIDIARIES
CONDENSED NOTES TO CONSOLIDATED FINANCIAL STATEMENTS
January 31, 2021
(Unaudited)
Costs incurred to develop internal-use software during the preliminary project stage are expensed as incurred. Internal-use software development costs are capitalized during the application development stage, which is after: (i) the preliminary project stage is completed; and (ii) management authorizes and commits to funding the project and it is probable the project will be completed and used to perform the function intended. Capitalization ceases at the point the software project is substantially complete and ready for its intended use, and after all substantial testing is completed. Upgrades and enhancements are capitalized if it is probable that those expenditures will result in additional functionality. Amortization is provided for on a straight-line basis over the expected useful life of five years of the internal-use software development costs and related upgrades and enhancements. When existing software is replaced with new software, the unamortized costs of the old software are expensed when the new software is ready for its intended use.
Leasehold improvements are amortized using the straight-line method over the lesser of eight years or lease term.
The Company has construction in progress which includes property and equipment amounts for new campuses. These assets are not yet being depreciated as of January 31, 2021.
Upon the retirement or disposition of property and equipment, the related cost and accumulated depreciation or amortization are removed and a gain or loss is recorded in the consolidated statements of operations. Repairs and maintenance costs are expensed in the period incurred.
Courseware and Accreditation
The Company records the costs of courseware and accreditation in accordance with Financial Accounting Standards Board (“FASB”) Accounting Standards Codification (“ASC”) Topic 350 “Intangibles - Goodwill and Other”.
Generally, costs of courseware creation and enhancement are capitalized. Accreditation renewal or extension costs related to intangible assets are capitalized as incurred. Courseware is stated at cost less accumulated amortization. Amortization is provided for on a straight-line basis over the expected useful life of five years.
Long-Lived Assets
The Company assesses potential impairment to its long-lived assets when there is evidence that events or changes in circumstances indicate that the carrying amount of an asset may not be recoverable. Events and circumstances considered by the Company in determining whether the carrying value of identifiable intangible assets and other long-lived assets may not be recoverable include, but are not limited to: significant changes in performance relative to expected operating results, significant changes in the use of the assets, significant negative industry or economic trends, a significant decline in the Company’s stock price for a sustained period of time, and changes in the Company’s business strategy. An impairment loss is recorded when the carrying amount of the long-lived asset is not recoverable and exceeds its fair value. The carrying amount of a long-lived asset is not recoverable if it exceeds the sum of the undiscounted cash flows expected to result from the use and eventual disposition of the asset. Any required impairment loss is measured as the amount by which the carrying amount of a long-lived asset exceeds fair value and is recorded as a reduction in the carrying value of the related asset and an expense to operating results.
Due to Students
The Company receives Title IV funds from the Department of Education to cover tuition and living expenses. After deducting tuition and fees, the Company sends checks for the remaining balances to the students.
Leases
The Company enters into various lease agreements in conducting its business. At the inception of each lease, the Company evaluates the lease agreement to determine whether the lease is an operating or financing lease. Leases may contain initial periods of free rent and/or periodic escalations. When such items are included in a lease agreement, the Company records rent expense on a straight-line basis over the initial term of a lease. The difference between the rent payment and the straight-line rent expense is recorded as additional amortization. The Company expenses any additional payments under its operating leases for taxes, insurance or other operating expenses as incurred.
ASPEN GROUP, INC. AND SUBSIDIARIES
CONDENSED NOTES TO CONSOLIDATED FINANCIAL STATEMENTS
January 31, 2021
(Unaudited)
In February 2016, the FASB issued Accounting Standards Update ("ASU") No. 2016-2, Leases (Topic 842). This standard requires entities to recognize most operating leases on their balance sheets as right-of-use assets with a corresponding lease liability, along with disclosing certain key information about leasing arrangements. The Company adopted the standard effective May 1, 2019 using the cumulative effect adjustment transition method, which applies the provisions of the standard at the effective date without adjusting the comparative periods presented. The Company adopted the following practical expedients and elected the following accounting policies related to this standard:
•Carry forward of historical lease classification;
•Short-term lease accounting policy election allowing lessees to not recognize right-of-use assets and lease liabilities for leases with a term of 12 months or less; and
•Not separate lease and non-lease components for office space and campus leases.
The adoption of this standard resulted in the recognition of an initial operating lease right-of-use assets (“ROU’s”) and corresponding lease liabilities of approximately $8 million, on the unaudited consolidated balance sheet as of May 1, 2019. There was no impact to the Company’s net income or liquidity as a result of the adoption of this ASU. Additionally, the standard did not materially impact the Company's unaudited consolidated statements of cash flows.
Disclosures related to the amount, timing, and uncertainty of cash flows arising from leases are included in Note 9.
Treasury Stock
Purchases and sales of treasury stock are accounted for using the cost method. Under this method, shares acquired are recorded at the acquisition price directly to the treasury stock account. Upon sale, the treasury stock account is reduced by the original acquisition price of the shares and any difference is recorded in equity. This method does not allow the company to recognize a gain or loss to income from the purchase and sale of treasury stock.
Revenue Recognition and Deferred Revenue
The Company follows Accounting Standards Codification 606 (ASC 606). ASC 606 is based on the principle that revenue is recognized to depict the transfer of goods or services to customers in an amount that reflects the consideration to which the entity expects to be entitled in exchange for those goods or services. This ASC also requires additional disclosure about the nature, amount, timing, and uncertainty of revenue and cash flows arising from customer purchase orders, including significant judgments. Our adoption of this ASC resulted in no change to our consolidated results of operations or our consolidated balance sheet and there was no cumulative effect adjustment.
Revenues consist primarily of tuition and course fees derived from courses taught by the Company online as well as from related educational resources and services that the Company provides to its students. Under ASC 606, tuition and course fee revenue is recognized pro-rata over the applicable period of instruction and are not considered separate performance obligations. Non-tuition related revenue and fees are recognized as services are provided or when the goods are received by the student. (See Note 8)
Deferred revenue represents the amount of tuition, fees, and other student payments received in excess of the portion recognized as revenue and it is included in current liabilities in the accompanying consolidated balance sheets. Other revenue may be recognized as sales occur or services are performed.
Cost of Revenues
Cost of revenues consists of two categories of cost, instructional costs and services, and marketing and promotional costs.
Instructional Costs and Services
Instructional costs and services consist primarily of costs related to the administration and delivery of the Company's educational programs. This expense category includes compensation costs associated with online faculty, technology license costs and costs associated with other support groups that provide services directly to the students and are included in cost of
ASPEN GROUP, INC. AND SUBSIDIARIES
CONDENSED NOTES TO CONSOLIDATED FINANCIAL STATEMENTS
January 31, 2021
(Unaudited)
revenues. For the three months ended January 31, 2021 and 2020, total instructional costs and services were $3,915,095 and $2,623,252, respectively, and are included in cost of revenue. For the nine months ended January 31, 2021 and 2020, total instructional costs and services were $10,698,056 and $6,948,138, respectively.
Marketing and Promotional Costs
Marketing and promotional costs include costs associated with producing marketing materials and advertising. Such costs are generally affected by the cost of advertising media, the efficiency of the Company's marketing and recruiting efforts, and expenditures on advertising initiatives for new and existing academic programs. Non-direct response advertising activities are expensed as incurred, or the first time the advertising takes place, depending on the type of advertising activity. For the three months ended January 31, 2021 and 2020, total marketing and promotional costs were $3,644,856 and $2,539,755, respectively, and are included in cost of revenue. For the nine months ended January 31, 2021 and 2020, total marketing and promotional costs were $10,034,198 and $6,755,983, respectively.
General and Administrative
General and administrative expenses include compensation of employees engaged in corporate management, finance, human resources, information technology, academic operations, compliance and other corporate functions. General and administrative expenses also include professional services fees, financial aid processing costs, non-capitalizable courseware and software costs, travel and entertainment expenses and facility costs.
Legal Expenses
All legal costs for litigation are charged to expense as incurred.
Income Tax
The Company uses the asset and liability method to compute the differences between the tax basis of assets and liabilities and the related financial statement amounts. Valuation allowances are established, when necessary, to reduce deferred tax assets to the amount that more likely than not will be realized. The Company has deferred tax assets and liabilities that reflect the net tax effects of temporary differences between the carrying amounts of assets and liabilities for financial reporting purposes and the amounts used for income tax purposes. Deferred tax assets are subject to periodic recoverability assessments. Realization of the deferred tax assets, net of deferred tax liabilities, is principally dependent upon achievement of projected future taxable income.
The Company records a liability for unrecognized tax benefits resulting from uncertain tax positions taken or expected to be taken in a tax return. The Company accounts for uncertainty in income taxes using a two-step approach for evaluating tax positions. Step one, recognition, occurs when the Company concludes that a tax position, based solely on its technical merits, is more likely than not to be sustained upon examination. Step two, measurement, is only addressed if the position is more likely than not to be sustained. Under step two, the tax benefit is measured as the largest amount of benefit, determined on a cumulative probability basis, which is more likely than not to be realized upon ultimate settlement. The Company recognizes interest and penalties, if any, related to unrecognized tax benefits in income tax expense.
Accounting for Derivatives
The Company evaluates its convertible instruments, options, warrants or other contracts to determine if those contracts or embedded components of those contracts qualify as derivatives to be separately accounted for under ASC Topic 815, “Derivatives and Hedging”. The result of this accounting treatment is that the fair value of the derivative is marked-to-market each balance sheet date and recorded as a liability. In the event that the fair value is recorded as a liability, the change in fair value is recorded in the statement of operations as other income (expense). Upon conversion, exercise, or other extinguishment (transaction) of a derivative instrument, the instrument is marked to fair value at the transaction date and then that fair value is recognized as an extinguishment gain or loss. Equity instruments that are initially classified as equity that become subject to reclassification under ASC Topic 815 are reclassified to liability at the fair value of the instrument on the reclassification date.
ASPEN GROUP, INC. AND SUBSIDIARIES
CONDENSED NOTES TO CONSOLIDATED FINANCIAL STATEMENTS
January 31, 2021
(Unaudited)
The Company follows FASB ASU 2017-11, which simplifies the accounting for certain equity-linked financial instruments and embedded features with down round features that reduce the exercise price when the pricing of a future round of financing is lower. This allows the Company to treat such instruments or their embedded features as equity instead of considering them as a derivative. If such a feature is triggered in a stand-alone instrument treated as equity, the value is measured pre-trigger and post-trigger. The difference in these two measurements is treated as a dividend, reducing income. The value recognized as a dividend is not subsequently remeasured, but in instances where the feature is triggered multiple times each instance is recognized.
Stock-Based Compensation
Stock-based compensation expense is measured at the grant date fair value of the award and is expensed over the requisite service period, which is included in general and administrative expense in the consolidated statement of operations. For employee stock-based awards, the Company calculates the fair value of the award on the date of grant using the Black-Scholes option pricing model. Determining the fair value of stock-based awards at the grant date under this model requires judgment, including estimating volatility, employee stock option exercise behaviors and forfeiture rates. The assumptions used in calculating the fair value of stock-based awards represent the Company's best estimates, but these estimates involve inherent uncertainties and the application of management judgment. For non-employee stock-based awards, the Company follows ASU 2018-7, which substantially aligns share based compensation for employees and non-employees.
RSUs are awards in the form of shares denominated in the equivalent number of shares of ASPU common stock and with the value of each RSU being equal to the fair value of ASPU common stock at the date of grant. RSU awards may be subject to service-based vesting, where a specific period of continued employment must pass before an award vests and/or other vesting restrictions based on the nature and recipient of the award. For RSU awards, the expense is typically measured at the grant date as the fair value of ASPU common stock and expensed as stock-based compensation over the vesting term, which is included in general and administrative expense in the consolidated statement of operations.
Business Combinations
We include the results of operations of businesses we acquire from the date of the respective acquisition. We allocate the purchase price of acquisitions to the assets acquired and liabilities assumed at fair value. The excess of the purchase price of an acquired business over the amount assigned to the assets acquired and liabilities assumed is recorded as goodwill. We expense transaction costs associated with business combinations as incurred.
Net Loss Per Share
Net loss per share is based on the weighted average number of shares of common stock outstanding during each period. Options to purchase 1,260,213 and 2,776,778 shares, 669,337 and 0 restricted stock units ("RSUs"), warrants to purchase 374,174 and 566,223 shares, and unvested restricted stock of 8,224 and 226,922 were outstanding at January 31, 2021 and January 31, 2020, respectively.
Additionally, $10,000,000 of convertible debt (convertible into 1,398,602 shares of common stock) was outstanding at January 31, 2020. All shares mentioned above were not included in the computation of diluted net loss per share because the effects would have been anti-dilutive. The options, warrants and convertible debt are considered to be common stock equivalents and are only included in the calculation of diluted earnings per share of common stock when their effect is dilutive.
Segment Information
The Company operates in one reportable segment as a single educational delivery operation using a core infrastructure that serves the curriculum and educational delivery needs of its online and campus students regardless of geography. The Company's chief operating decision makers, its Chief Executive Officer, Chief Operating Officer and Chief Academic Officer, manage the Company's operations as a whole.
Recent Accounting Pronouncement not Yet Adopted
ASU No. 2016-13, Financial Instruments—Credit Losses (Topic 326): Measurement of Credit Losses on Financial Instruments
ASPEN GROUP, INC. AND SUBSIDIARIES
CONDENSED NOTES TO CONSOLIDATED FINANCIAL STATEMENTS
January 31, 2021
(Unaudited)
In June 2016, the FASB issued ASU No. 2016-13, Financial Instruments—Credit Losses (Topic 326): Measurement of Credit Losses on Financial Instruments, which significantly changes how entities will measure credit losses for most financial assets, including accounts receivable. ASU No. 2016-13 will replace today’s “incurred loss” approach with an “expected loss” model, under which companies will recognize allowances based on expected rather than incurred losses. On November 15, 2019, the FASB delayed the effective date of Topic 326 for certain small public companies and other private companies until fiscal years beginning after December 15, 2022 for SEC filers that are eligible to be smaller reporting companies under the SEC’s definition, as well as private companies and not-for-profit entities. The Company is currently evaluating the new guidance and has not yet determined whether the adoption of the new standard will have a material impact on its consolidated financial statements or the method of adoption.
Reclassifications
Certain prior year amounts have been reclassified to conform to the current year presentation.
Bad debt expense, which was previously included in general and administrative expense for the three and nine months ended January 31, 2020 of $2,547 and $651,205, respectively, is now reported separately as a component of operating expenses for all periods presented. See Statements of operations for additional information.
Note 3. Property and Equipment
As property and equipment reach the end of their useful lives, the fully expired assets are written off against the associated accumulated depreciation. There is no expense impact for such write offs.
Property and equipment consisted of the following at January 31, 2021 and April 30, 2020:
| | | | | | | | | | | |
| January 31,
2021 | | April 30,
2020 |
| Computer equipment and hardware | $ | 799,826 | | | $ | 649,927 | |
| Furniture and fixtures | 1,013,103 | | | 1,007,099 | |
| Leasehold improvements | 920,736 | | | 867,024 | |
| Instructional equipment | 315,993 | | | 301,842 | |
| Software | 7,944,693 | | | 6,162,770 | |
| Construction in Progress | 907,780 | | | — | |
| 11,902,131 | | | 8,988,662 | |
| Accumulated depreciation and amortization | (4,355,308) | | | (2,841,019) | |
| Property and equipment, net | $ | 7,546,823 | | | $ | 6,147,643 | |
Software consisted of the following at January 31, 2021 and April 30, 2020:
| | | | | | | | | | | |
| January 31,
2021 | | April 30,
2020 |
| Software | $ | 7,944,693 | | | $ | 6,162,770 | |
| Accumulated amortization | (3,078,213) | | | (2,049,809) | |
| Software, net | $ | 4,866,480 | | | $ | 4,112,961 | |
Depreciation and amortization expense for property and equipment as well as the portion for just software amortization is presented below for the three and nine months ended January 31, 2021 and 2020:
| | | | | | | | | | | | | | | | | | | | | | | |
| Three Months Ended
January 31, | | Nine Months Ended
January 31, |
| 2021 | | 2020 | | 2021 | | 2020 |
| Depreciation and amortization expense | $ | 525,018 | | | $ | 364,504 | | | $ | 1,519,536 | | | $ | 1,012,548 | |
| | | | | | | |
| Software amortization expense | $ | 366,908 | | | $ | 265,146 | | | $ | 1,028,668 | | | $ | 728,395 | |
ASPEN GROUP, INC. AND SUBSIDIARIES
CONDENSED NOTES TO CONSOLIDATED FINANCIAL STATEMENTS
January 31, 2021
(Unaudited)
The following is a schedule of estimated future amortization expense of software at January 31, 2021 (by fiscal year):
| | | | | | | | |
| | Future Expense |
| 2021 (remaining) | | $ | 369,241 | |
| 2022 | | 1,452,508 | |
| 2023 | | 1,291,627 | |
| 2024 | | 1,003,841 | |
| 2025 | | 594,137 | |
| Thereafter | | 155,126 | |
| Total | | $ | 4,866,480 | |
Note 4. USU Goodwill and Intangibles
In connection with the acquisition of the USU business on December 1, 2017, the amount paid over the estimated fair values of the identifiable net assets was $5,011,432, which has been reflected in the consolidated balance sheet as goodwill.
The goodwill resulting from the acquisition may become deductible for tax purposes in the future. The goodwill resulting from the acquisition is principally attributable to the future earnings potential associated with enrollment growth and other intangibles that do not qualify for separate recognition such as the assembled workforce.
We assigned an indefinite useful life to the accreditation and regulatory approvals and the trade name and trademarks as we believe they have the ability to generate cash flows indefinitely. In addition, there are no legal, regulatory, contractual, economic or other factors to limit the intangibles’ useful life and the Company intends to renew the intangibles, as applicable, and renewal can be accomplished at little cost. We determined all other acquired intangibles are finite-lived and we are amortizing them on either a straight-line basis or using an accelerated method to reflect the pattern in which the economic benefits of the assets are expected to be consumed. The finite-lived assets became fully amortized during fiscal 2020. There was no amortization expense for the three and nine months ended January 31, 2021. Amortization expense for the three and nine months ended January 31, 2020 were $91,667 and $641,667, respectively.
Intangible assets at acquisition consisted of the following at January 31, 2021 and April 30, 2020:
| | | | | | | | | | | |
| January 31,
2021 | | April 30,
2020 |
| Intangible assets with indefinite lives | $ | 7,900,000 | | | $ | 7,900,000 | |
| Intangible assets with definite lives | 2,200,000 | | | 2,200,000 | |
| Accumulated amortization | (2,200,000) | | | (2,200,000) | |
| Total intangible assets with definite lives, net of accumulated amortization | — | | | — | |
| Total intangible assets, net | $ | 7,900,000 | | | $ | 7,900,000 | |
Note 5. Courseware and Accreditation
For the nine months ended January 31, 2021, additional courseware and accreditation costs capitalized were $31,330. As courseware and accreditation reach the end of their useful life, they are written off against the accumulated amortization. There is no expense impact for such write-offs.
Courseware and accreditation consisted of the following:
ASPEN GROUP, INC. AND SUBSIDIARIES
CONDENSED NOTES TO CONSOLIDATED FINANCIAL STATEMENTS
January 31, 2021
(Unaudited)
| | | | | | | | | | | |
| January 31,
2021 | | April 30,
2020 |
| Courseware | $ | 319,144 | | | $ | 287,813 | |
| Accreditation | 59,350 | | | 59,350 | |
| 378,494 | | | 347,163 | |
| Accumulated amortization | (268,425) | | | (235,706) | |
| Courseware and accreditation, net | $ | 110,069 | | | $ | 111,457 | |
Amortization expense of courseware and accreditation is as follows:
| | | | | | | | | | | | | | | | | | | | | | | |
| Three Months Ended January 31, | | Nine Months Ended January 31, |
| 2021 | | 2020 | | 2021 | | 2020 |
| Amortization expense | $ | 10,255 | | | $ | 15,637 | | | $ | 32,718 | | | $ | 53,415 | |
The following is a schedule of estimated future amortization expense of courseware and accreditation at January 31, 2021 (by fiscal year):
| | | | | | | | |
| | Future Expense |
| 2021 (remaining) | | $ | 9,536 | |
| 2022 | | 36,940 | |
| 2023 | | 31,415 | |
| 2024 | | 17,868 | |
| 2025 | | 6,780 | |
| Thereafter | | 7,530 | |
| Total | | $ | 110,069 | |
Note 6. Debt
Convertible Notes
On January 22, 2020, the Company issued $5 million in principal amount convertible notes (“Convertible Notes”) to each of two lenders in exchange for the two $5 million notes issued under senior secured term loans entered into in March 2019 as discussed below (the “Term Loans”). The Company recorded a beneficial conversion feature on these Convertible Notes of $1,692,309. The Convertible Notes have been automatically converted into common stock as explained below.
The closing of the refinancing was conditioned upon the Company conducting an equity financing resulting in gross proceeds to the Company of at least $10 million. On January 22, 2020, the Company closed on an underwritten public offering for net proceeds of approximately $16 million and the condition precedent to the closing of the refinancing was satisfied. The key terms of the Convertible Notes were as follows:
•After six months from the issuance date, the lenders had the right to convert the principal into our shares of the Company’s common stock at a conversion price of $7.15 per share;
•The Convertible Notes automatically convert into shares of the Company’s common stock if the average closing price of our common stock is at least $10.725 over a 20 consecutive trading day period;
•The Convertible Notes were due January 22, 2023 or approximately three years from the closing;
•The interest rate of the Convertible Notes was 7% per annum (payable monthly in arrears); and
•The Convertible Notes were secured.
The former term notes under the Senior Secured Term Loans were due in September 2020, as noted below, and were subject to a one-year extension and the payment of an extension fee for each note of $50,000 (total of $100,000), which was not required to be paid since the Senior Secured Term Loans were not extended. The Company also paid each lender $40,400 at closing of
ASPEN GROUP, INC. AND SUBSIDIARIES
CONDENSED NOTES TO CONSOLIDATED FINANCIAL STATEMENTS
January 31, 2021
(Unaudited)
the Convertible Notes offering to cover taxes they would incur as part of the note exchange and paid their legal fees arising from the re-financing, which is included in general and administrative expense in the consolidated statement of operations.
The Company’s obligations under the Convertible Notes were secured by a first priority lien in certain deposit accounts of the Company, all current and future accounts receivable of Aspen University and USU, certain of the deposit accounts of Aspen University and USU, and all of the outstanding capital stock of Aspen University and USU (the “Collateral”).
On March 6, 2019, in connection with entering into the Term Loan Agreements, the Company also entered into an intercreditor agreement (the “Intercreditor Agreement”) among the Company, the Lenders and the Foundation, individually. The Intercreditor Agreement provides among other things that the Company’s obligations under this agreement, and the security interests in the Collateral granted pursuant to the Term Loan Agreements and the Amended and Restated Facility Agreement shall rank pari passu to one another. The Security Agreement was amended on January 22, 2020 to give effect to the Convertible Note issuances.
On September 14, 2020, after the closing price of our common stock was at least $10.725 over a 20 consecutive trading day period the Convertible Notes automatically converted into 1,398,602 shares of the Company’s common stock at a conversion price of $7.15 per share. (See Note 7.) The accelerated amortization charge related to unamortized debt discounts as a result of the debt extinguishment in the second quarter of fiscal year 2021 was approximately $1.4 million, which was included in interest expense in the consolidated statement of operations. The Company did not recognize any gains or losses as a result of this conversion.
Revolving Credit Facility
On November 5, 2018, the Company entered into a loan agreement (the “Credit Facility Agreement”) with the Leon and Toby Cooperman Family Foundation (the “Foundation”). The Credit Facility Agreement provides for a $5,000,000 revolving credit facility (the “Facility”) evidenced by a revolving promissory note (the “Revolving Note”). Borrowings under the Credit Facility Agreement bear interest at 12% per annum. The Facility matures on November 4, 2021.
Pursuant to the terms of the Credit Facility Agreement, the Company agreed to pay to the Foundation a $100,000 one-time upfront Facility fee. The Company also agreed to pay the Foundation a commitment fee, payable quarterly at the rate of 2% per annum on the undrawn portion of the Facility. At January 31, 2021 and April 30, 2020, there were no outstanding borrowings under the Revolving Credit Facility.
The Credit Facility Agreement contains customary representations and warranties, events of default and covenants. Pursuant to the Loan Agreement and the Revolving Note, all future or contemporaneous indebtedness incurred by the Company, other than indebtedness expressly permitted by the Credit Facility Agreement and the Revolving Note, will be subordinated to the Facility.
Pursuant to the Credit Facility Agreement, on November 5, 2018 the Company issued to the Foundation warrants to purchase 92,049 shares of the Company’s common stock exercisable for five years from the date of issuance at the exercise price of $5.85 per share which were deemed to have a relative fair value of $255,071 (the "2018 Cooperman Warrants"). These warrants were exercised on June 8, 2020, see Note 7. The relative fair value of the warrants along with the upfront Facility fee were treated as debt issue costs, as the facility has not been drawn on, assets to be amortized over the term of the loan. Total unamortized costs at January 31, 2021 and April 30, 2020 were $26,389 and $182,418, respectively.
On March 6, 2019, in connection with entering into the Senior Secured Term Loans, the Company amended and restated the Credit Facility Agreement (the “Amended and Restated Facility Agreement”) and the Revolving Note. The Amended and Restated Facility Agreement provides among other things that the Company’s obligations thereunder are secured by a first priority lien in the Collateral, on a pari passu basis with the Lenders.
Term Loans
On March 6, 2019, the Company entered into two loan agreements (each a “Loan Agreement” and together, the “Loan Agreements”) with the Foundation, of which Mr. Leon Cooperman, a stockholder of the Company, is the trustee, and another stockholder of the Company (each a “Lender” and together, the “Lenders”). Each Loan Agreement provides for a $5,000,000 term loan (each a “Loan” and together, the “Loans”), evidenced by a term promissory note and security agreement (each a
ASPEN GROUP, INC. AND SUBSIDIARIES
CONDENSED NOTES TO CONSOLIDATED FINANCIAL STATEMENTS
January 31, 2021
(Unaudited)
“Term Note” and together, the “Term Notes”), for combined total proceeds of $10,000,000 million. The Company borrowed $5,000,000 from each Lender that day. The Term Notes bear interest at 12% per annum and were to mature on September 6, 2020, subject to one 12-month extension upon the Company’s option, and upon payment of a 1% one-time extension fee.
Pursuant to the Loan Agreements and the Term Notes, all future or contemporaneous indebtedness incurred by the Company, other than indebtedness expressly permitted by the Loan Agreements and the Term Notes, will be subordinated to the Loans.
Pursuant to the Loan Agreements, on March 6, 2019 the Company issued to each Lender warrants to purchase 100,000 shares of the Company’s common stock exercisable for five years from the date of issuance at the exercise price of $6.00 per share. The two warrants were deemed to have a combined relative fair value of $360,516. The relative fair value along with closing costs of $33,693 were treated as debt discounts to be amortized over the term of the Loans. One Lender exercised 100,000 of these warrants (the "2019 Cooperman Warrants") on June 5, 2020, see Note 7.
On January 22, 2020, the Senior Secured Term Loans were cancelled and exchanged for convertible notes as discussed above. In connection with this transaction, the Company wrote off approximately $182,000 of unamortized debt issuance costs included in interest expense on the consolidated statements of operations as the transaction qualified as a debt extinguishment.
Note 7. Stockholders’ Equity
Preferred Stock
The Company is authorized to issue 1,000,000 shares of “blank check” preferred stock with designations, rights and preferences as may be determined from time to time by our Board of Directors. As of January 31, 2021 and April 30, 2020, we had no shares of preferred stock issued and outstanding.
Common Stock
At January 31, 2021, the Company is authorized to issue 40,000,000 shares of common stock.
On August 31, 2020, the Company entered into an Equity Distribution Agreement (the “Agreement”) with Canaccord Genuity LLC (“Canaccord”), pursuant to which the Company may issue and sell from time to time, through Canaccord, up to $12,309,750 of shares of the Company’s common stock (the “Shares”). The Shares are being offered and sold pursuant to a prospectus supplement filed with the Securities and Exchange Commission on August 31, 2020. The purpose of this Agreement is, among other things, to allow the Company to sell common stock that has been surrendered from executive officers and directors related to vesting of RSUs and exercise of stock options as well as the funds the Company would otherwise have received if the stock options exercised under the net share program were exercised for cash. During the nine months ended January 31, 2021, the Company sold 449,632 shares under the Agreement. On February 8, 2021, the Company provided written notice to Canaccord Genuity of its election to terminate the Equity Distribution Agreement. This action terminates the Company’s at-the-market offering facility effective February 18, 2021. See Note 11.
Sales of the Shares may be made by any method permitted by law deemed to be an “at-the-market” offering as defined in Rule 415 of the Securities Act of 1933, including without limitation sales made directly on or through The Nasdaq Global Market, the trading market for the Company’s common stock, on any other existing trading market in the United States for the Company’s common stock, or to or through a market maker. Canaccord may also sell the Shares by any other method permitted by law, including in privately negotiated transactions. Canaccord will use commercially reasonable efforts to sell on the Company’s behalf all of the Shares requested to be sold by the Company, consistent with its normal trading and sales practices, subject to the terms of the Agreement. Under the Agreement, Canaccord is entitled to compensation of 3% of the gross proceeds from the sales of the Shares sold under the Agreement. The Company also reimbursed Canaccord for certain specified expenses, including the fees and disbursements of its legal counsel, in an amount of $50,000. Total expenses for the offering, excluding compensation and reimbursement payable to Canaccord under the terms of the Agreement, was approximately $50,000, which is included in general and administrative expense in the consolidated statement of operations.
During the three months ended January 31, 2021, the Company issued 447,134 shares of common stock upon the exercise of stock options for cash and received proceeds of $363,385. As of January 31, 2021, 155,486 shares of common stock related to
ASPEN GROUP, INC. AND SUBSIDIARIES
CONDENSED NOTES TO CONSOLIDATED FINANCIAL STATEMENTS
January 31, 2021
(Unaudited)
the Company options exercised by the executive officers were surrendered to the Company. (See Treasury stock discussion below.)
During the three months ended January 31, 2021, the Company issued 74,000 shares of common stock upon the vesting of RSUs.
During the three months ended January 31, 2021, the Company issued 2,000 shares of common stock to a former director for services provided. The shares were valued using a grant date share price of $9.95 and the Company recognized $19,900 of expense.
During the three months ended October 31, 2020, the Company issued 502,412 shares of common stock upon the exercise of stock options for cash and received proceeds of $945,332.
During the three months ended October 31, 2020, the Company issued 132,109 shares of common stock upon the vesting of Restricted Stock Units (“RSUs”).
During the three months ended October 31, 2020, the Company issued 22,339 shares of common stock upon the cashless exercise of 36,111 stock options.
On September 14, 2020, after the closing price of our common stock was at least $10.725 over a 20 consecutive trading day period, the $10 million Convertible Notes (see Note 6) automatically converted into 1,398,602 shares of the Company’s common stock at a conversion price of $7.15 per share.
During the three months ended July 31, 2020, the Company issued 415,175 shares of common stock upon the exercise of stock options for cash and received proceeds of $1,269,982.
During the three months ended July 31, 2020, the Company issued 192,049 shares of common stock upon the exercise of warrants for cash and received proceeds of $1,081,792.
Restricted Stock
As of January 31, 2021 and 2020, there were 8,224 and 226,922 unvested shares of restricted common stock outstanding, respectively. Total unrecognized compensation expense related to the unvested shares as of January 31, 2021 and 2020 amounted to $38,598 and $1,285,524, respectively.
Restricted Stock Units
A summary of the Company’s RSU activity which were granted under the 2012 and 2018 Equity Incentive Plans during the nine months ended January 31, 2021 is presented below:
| | | | | | | | | | | | | | |
| Restricted Stock Units | | Number of Shares | | Weighted Average Grant Price |
| Unvested balance outstanding, April 30, 2020 | | 643,175 | | | $ | 5.64 | |
| Granted | | 251,521 | | | 9.82 | |
| Exercised | | — | | | — | |
| Forfeits | | (19,250) | | | 8.94 | |
| Vested | | (206,109) | | | 12.46 | |
| Expired | | — | | | — | |
| Unvested balance outstanding, January 31, 2021 | | 669,337 | | | $ | 6.95 | |
| | | | |
Of the 251,521 RSU grants, 15,791 RSUs correspond to RSUs granted to the Board of Directors. The grant occurred during the three months ending January 31, 2021 and immediately vested with a fair value of $11.13 per share and total expense of $175,754. The grant date fair value of the remaining awards range from $6.95 to $12.78 per share, or a total of $2.1 million, with an annual vest over three years.
ASPEN GROUP, INC. AND SUBSIDIARIES
CONDENSED NOTES TO CONSOLIDATED FINANCIAL STATEMENTS
January 31, 2021
(Unaudited)
There were 669,337 unvested RSUs as of January 31, 2021. Total unrecognized compensation expense related to the unvested RSUs is approximately $4.6 million which will be amortized over the remaining vesting periods. Included in this amount is approximately $1.7 million of total unrecognized compensation expense related to the $12 tranche of the executive RSU grant of 243,750 RSUs discussed below.
On February 4, 2020, the Compensation Committee approved a 375,000 RSU grant to executives under the Company’s 2018 Equity Incentive Plan. As subsequently clarified, the RSUs vest four years from the grant date, if each applicable executive is still employed by the Company on the vesting date and subject to accelerated vesting for all RSUs as follows: (i) if the closing price of the Company’s common stock is at least $9 for 20 consecutive trading days, 10% of the RSUs will vest immediately; (ii) if the closing price of the Company’s common stock is at least $10 for 20 consecutive trading days, 25% of the RSUs will vest immediately; and (iii) if the closing price of the Company’s common stock is at least $12 for 20 consecutive trading days, all of the unvested RSUs will vest immediately. On the grant date, the closing price of the Company’s common stock on The Nasdaq Global Market was $9.49 per share. The Company determined that because the terms of the grant include both a market condition and a service condition that must be achieved simultaneously, the appropriate treatment under ASC 718 Stock-based Compensation is to amortize the fair market value of $3.4 million over the longer of the explicit service period of four years and not the shorter of the derived service period of .64 years.
On August 31, 2020, the closing price of the Company’s common stock was at least $9 for 20 consecutive trading days, resulting in 10% or 37,500 of the February 4, 2020 RSU grants to executives vesting immediately. Additionally, on September 2, 2020, the Company’s common stock was at least $10 for 20 consecutive trading days and 25% or 93,750 of the RSUs granted vested immediately. On the grant date, the closing price of the Company's common stock on The Nasdaq Global Market was $9.49 per share. The accelerated amortization expense related to these transactions in the second quarter of fiscal year 2021 was approximately $1.2 million, for the vesting of these 131,250 RSUs, which is included in general and administrative expense in the consolidated statements of operations.
The 48,750 unvested RSUs related to the February 4, 2020 grant, discussed above, held by the Company’s former Chief Financial Officer, Frank J. Cotroneo, were forfeited with his resignation in February 2021. See Note 11. Of the remaining approximately $1.7 million of total unrecognized compensation expense related to the $12 tranche of the executive RSU grant discussed above, the expense portion related to the Company's former Chief Financial Officer was approximately $0.3 million.
Warrants
A summary of the Company’s warrant activity during the nine months ended January 31, 2021 is presented below:
| | | | | | | | | | | | | | | | | | | | | | | | | | |
| Warrants | | Number of
Shares | | Weighted
Average
Exercise
Price | | Weighted
Average
Remaining
Contractual
Term | | Aggregate
Intrinsic
Value |
| Balance Outstanding, April 30, 2020 | | 566,223 | | | $ | 6.22 | | | 3.17 | | $ | 950,100 | |
| Granted | | — | | | $ | — | | | — | | | — | |
| Exercised | | (192,049) | | | $ | 5.60 | | | — | | | — | |
| Surrendered | | — | | | $ | — | | | — | | | — | |
| Expired | | — | | | $ | — | | | — | | | — | |
| Balance Outstanding, January 31, 2021 | | 374,174 | | | $ | 6.37 | | | 2.14 | | $ | 1,151,369 | |
| | | | | | | | |
| Exercisable, January 31, 2021 | | 374,174 | | | $ | 6.37 | | | 2.14 | | $ | 1,151,369 | |
ASPEN GROUP, INC. AND SUBSIDIARIES
CONDENSED NOTES TO CONSOLIDATED FINANCIAL STATEMENTS
January 31, 2021
(Unaudited)
| | | | | | | | | | | | | | | | | | | | | | | | | | | | | | | | |
| OUTSTANDING WARRANTS | | EXERCISABLE WARRANTS |
Exercise
Price | | Weighted
Average
Exercise
Price | | Outstanding
No. of
Warrants | | Weighted
Average
Exercise
Price | | Weighted
Average
Remaining Life
In Years | | Exercisable
No. of
Warrants |
| $ | 4.89 | | | $ | 4.89 | | | 50,000 | | | $ | 4.89 | | | 3.44 | | 50,000 | |
| $ | 6.00 | | | $ | 6.00 | | | 100,000 | | | $ | 6.00 | | | 3.09 | | 100,000 | |
| $ | 6.87 | | | $ | 6.87 | | | 224,174 | | | $ | 6.87 | | | 1.48 | | 224,174 | |
| | | | | 374,174 | | | | | | | 374,174 | |
On June 5, 2020, the Company, as an inducement to exercise, reduced by 5% the exercise price of the common stock purchase warrants issued to The Leon and Toby Cooperman Family Foundation (the “Foundation”), of which Mr. Leon Cooperman, a stockholder of the Company, is the trustee. The warrants were issued on November 5, 2018 (the “2018 Cooperman Warrants”) and on March 5, 2019 (the “2019 Cooperman Warrants”). The 2018 Cooperman Warrants exercise price was reduced from $5.85 to $5.56 per share. The 2019 Cooperman Warrants exercise price was reduced from $6.00 to $5.70 per share. On June 8, 2020, the Foundation immediately exercised the 2018 and 2019 Cooperman Warrants for 192,049 shares on common stock paying the Company $1,081,792 and the Company issued 192,049 shares of common stock to the Foundation. The warrant modification and acceleration charge related to this transaction in the first quarter of fiscal year 2021 was approximately $26,000.
Stock Incentive Plan and Stock Option Grants to Employees and Directors
On March 13, 2012, the Company adopted the Aspen Group, Inc. 2012 Equity Incentive Plan (the “2012 Plan”) that provides for the grant of 3,500,000 shares in the form of incentive stock options, non-qualified stock options, restricted shares, stock appreciation rights and RSUs to employees, consultants, officers and directors.
On December 13, 2018, the stockholders of the Company approved the Aspen Group, Inc. 2018 Equity Incentive Plan (the “2018 Plan”) that provides for the grant of 500,000 shares in the form of incentive stock options, non-qualified stock options, restricted shares, stock appreciation rights and RSUs to employees, consultants, officers and directors.
On December 30, 2019, the Company held its Annual Meeting of Shareholders at which the shareholders voted to amend the 2018 Plan to increase the number of shares of common stock available for issuance under the 2018 Plan from 500,000 to 1,100,000 shares.
On December 21, 2020, the Company held its Annual Meeting of Shareholders at which the shareholders voted to amend the 2018 Plan to increase the number of shares of common stock authorized for issuance thereunder from 1,100,000 to 1,600,000 shares.
As of January 31, 2021 and 2020 there were 515,491 and 286,398 shares remaining available for future issuance under the 2012 Plan and the 2018 Plan.
The Company estimates the fair value of share-based compensation utilizing the Black-Scholes option pricing model, which is dependent upon several variables such as the expected option term, expected volatility of the Company’s stock price over the expected term, expected risk-free interest rate over the expected option term and expected dividend yield rate over the expected option term. The Company believes this valuation methodology is appropriate for estimating the fair value of stock options granted to employees and directors which are subject to ASC Topic 718 requirements. These amounts are estimates and thus may not be reflective of actual future results, nor amounts ultimately realized by recipients of these grants. The Company recognizes compensation on a straight-line basis over the requisite service period for each award.
The Company utilizes the simplified method to estimate the expected life for stock options granted to employees. The simplified method was used as the Company does not have sufficient historical data regarding stock option exercises. The expected volatility is based on historical volatility. The risk-free interest rate is based on the U.S. Treasury yields with terms equivalent to the expected life of the related option at the time of the grant. Dividend yield is based on historical trends. While
ASPEN GROUP, INC. AND SUBSIDIARIES
CONDENSED NOTES TO CONSOLIDATED FINANCIAL STATEMENTS
January 31, 2021
(Unaudited)
the Company believes these estimates are reasonable, the compensation expense recorded would increase if the expected life was increased, a higher expected volatility was used, or if the expected dividend yield increased.
There were no options granted to employees during the three and nine months ended January 31, 2021.
A summary of the Company’s stock option activity for employees and directors during the nine months ended January 31, 2021, is presented below:
| | | | | | | | | | | | | | | | | | | | | | | | | | |
| Options | | Number of
Shares | | Weighted
Average
Exercise
Price | | Weighted
Average
Remaining
Contractual
Term | | Aggregate
Intrinsic
Value |
| Balance Outstanding, April 30, 2020 | | 2,740,539 | | | $ | 4.62 | | | 1.97 | | $ | 9,146,198 | |
| Granted | | — | | | $ | — | | | — | | | — | |
| Exercised | | (1,400,832) | | | $ | 10.80 | | | — | | | — | |
| Forfeited | | (7,585) | | | $ | 6.23 | | | — | | | — | |
| Expired | | (71,909) | | | $ | 3.98 | | | — | | | — | |
Balance Outstanding, January 31, 2021 | | 1,260,213 | | | $ | 6.13 | | | 2.08 | | $ | 4,184,115 | |
| | | | | | | | |
Exercisable, January 31, 2021 | | 1,038,024 | | | $ | 6.14 | | | 1.94 | | $ | 3,432,509 | |
| | | | | | | | | | | | | | | | | | | | | | | | | | | | | | | | |
| OUTSTANDING OPTIONS | | EXERCISABLE OPTIONS |
Exercise
Price | | Weighted
Average
Exercise
Price | | Outstanding
No. of
Options | | Weighted
Average
Exercise
Price | | Weighted
Average
Remaining Life
In Years | | Exercisable
No. of
Options |
| | | | | | | | | | |
$1.57 to $2.10 | | $ | 1.92 | | | 29,167 | | | $ | 1.92 | | | 0.44 | | 29,167 | |
| | | | | | | | | | |
$2.28 to $2.76 | | $ | 2.76 | | | 11,415 | | | $ | 2.76 | | | 0.67 | | 11,415 | |
| | | | | | | | | | |
$3.24 to $4.38 | | $ | 3.82 | | | 188,639 | | | $ | 3.75 | | | 1.32 | | 146,804 | |
| | | | | | | | | | |
$4.50 to $5.20 | | $ | 4.94 | | | 362,818 | | | $ | 4.95 | | | 1.82 | | 297,714 | |
| | | | | | | | | | |
$5.95 to $6.28 | | $ | 6.10 | | | 66,000 | | | $ | 6.10 | | | 1.47 | | 66,000 | |
| | | | | | | | | | |
$7.17 to $7.55 | | $ | 7.44 | | | 444,425 | | | $ | 7.43 | | | 2.62 | | 329,175 | |
| | | | | | | | | | |
$8.57 to $9.07 | | $ | 8.98 | | | 157,749 | | | $ | 8.98 | | | 1.93 | | 157,749 | |
| | | | | | | | | | |
| Options only | | | | 1,260,213 | | | | | | | 1,038,024 | |
For the three months ended January 31, 2021, the Company recorded compensation expense of $721,067 which consisted of: $123,401, $567,239 and $30,427, respectively, in connection with stock option, RSUs and restricted and common stock grants.
ASPEN GROUP, INC. AND SUBSIDIARIES
CONDENSED NOTES TO CONSOLIDATED FINANCIAL STATEMENTS
January 31, 2021
(Unaudited)
For the nine months ended January 31, 2021, the Company recorded compensation expense of $3,039,729 which consisted of:$434,532, $2,553,717 and $51,480, respectively, in connection with stock option, RSUs and restricted and common stock grants.
As of January 31, 2021, there was approximately $275,000 of unrecognized compensation costs related to non-vested share-based option arrangements. That cost is expected to be recognized over a weighted-average period of approximately 1.1 years.
As of January 31, 2021, there was approximately $4.6 million of unrecognized compensation costs related to non-vested RSU grants. That cost is expected to be recognized over a weighted-average period of approximately 1.8 years.
As of January 31, 2021, there was approximately $39,000 of unrecognized compensation costs related to non-vested share-based common and restricted stock arrangements. That cost is expected to be recognized over a weighted-average period of approximately 1.0 year.
Treasury Stock
As of January 31, 2021, 155,486 shares of common stock were held in treasury representing shares of common stock surrendered upon the exercise of stock options in payment of the exercise prices and the taxes and similar amounts due arising from the option exercises. The values aggregating approximately $1.8 million are based upon the fair market value of shares surrendered as of the date of each applicable exercise date.
On October 16, 2020 the Company retired 16,667 shares of its treasury stock valued at $70,000, which was outstanding at April 30, 2020.
Note 8. Revenues
Revenues consist primarily of tuition and fees derived from courses taught by the Company online as well as from related educational resources that the Company provides to its students, such as access to our online materials and learning management system. The Company’s educational programs have starting and ending dates that differ from its fiscal quarters. Therefore, at the end of each fiscal quarter, a portion of revenue from these programs is not yet earned and is therefore deferred. The Company also charges students fees for library and technology costs, which are recognized over the related service period and are not considered separate performance obligations. Other services, books, and exam fees are recognized as services are provided or when goods are received by the student. The Company’s contract liabilities are reported as deferred revenue and due to students. Deferred revenue represents the amount of tuition, fees, and other student invoices in excess of the portion recognized as revenue and it is included in current liabilities in the accompanying unaudited consolidated balance sheets.
The following table represents our revenues disaggregated by the nature and timing of services:
| | | | | | | | | | | | | | | | | | | | | | | |
| Three Months Ended
January 31, | | Nine Months Ended
January 31, |
| | 2021 | | 2020 | | 2021 | | 2020 |
Tuition - recognized over period of instruction | $ | 14,580,439 | | | $ | 11,177,421 | | | $ | 42,922,429 | | | $ | 31,275,504 | |
Course fees - recognized over period of instruction | 1,834,251 | | | 1,194,947 | | | 5,220,308 | | | 3,240,160 | |
Book fees - recognized at a point in time | 44,468 | | | 23,195 | | | 129,643 | | | 64,611 | |
Exam fees - recognized at a point in time | 69,500 | | | 61,500 | | | 219,055 | | | 177,015 | |
Service fees - recognized at a point in time | 96,179 | | | 80,877 | | | 270,009 | | | 224,597 | |
| | $ | 16,624,837 | | | $ | 12,537,940 | | | $ | 48,761,444 | | | $ | 34,981,887 | |
Contract Balances and Performance Obligations
The Company recognizes deferred revenue as a student participates in a course which continues past the consolidated balance sheet date. At January 31, 2021, deferred revenue was $5,600,371 which is future revenue that has not yet been earned for courses in progress. Funds due to students was $2,243,690 at January 31, 2021, which mainly represents Title IV funds due to students after deducting their tuition payments.
ASPEN GROUP, INC. AND SUBSIDIARIES
CONDENSED NOTES TO CONSOLIDATED FINANCIAL STATEMENTS
January 31, 2021
(Unaudited)
Of the total revenue earned during the three and nine months ended January 31, 2021, approximately $8.6 million and $3.7 million came from revenues which were deferred at October 31, 2020 and April 30, 2020, respectively.
When the Company begins providing the performance obligation by beginning instruction in a course, a contract receivable is created, resulting in accounts receivable. The Company accounts for receivables in accordance with ASC 310, Receivables. The Company uses the portfolio approach, as discussed below.
AGI records an allowance for doubtful accounts for estimated losses resulting from the inability, failure or refusal of its students to make required payments, which includes financial aid funds advanced to a student for amounts in excess of the student’s cost of tuition and related fees, which are due back from the students. AGI determines the adequacy of its allowance for doubtful accounts using an allowance method based on an analysis of its historical bad debt experience, current economic trends, and the aging of the accounts receivable and student status. AGI applies reserves to its receivables based upon an estimate of the risk presented by the age of the receivables and student status. AGI writes off accounts receivable balances at the time the balances are deemed uncollectible. AGI continues to reflect accounts receivable with an offsetting allowance as long as management believes there is a reasonable possibility of collection.
Cash Receipts
Our students finance costs through a variety of funding sources, including, among others, monthly payment plans, installment plans, federal loan and grant programs (Title IV), employer reimbursement, and various veterans and military funding and grants, and cash payments. Most students elect to use our monthly payment plan. This plan allows them to make continuous monthly payments during the length of their program and through the length of their payment plan. Title IV and military funding typically arrives during the period of instruction. Students who receive reimbursement from employers typically do so after completion of a course. Students who choose to pay cash for a class typically do so before beginning the class.
Significant Judgments
We analyze revenue recognition on a portfolio approach under ASC 606-10-10-4. Significant judgment is utilized in determining the appropriate portfolios to assess for meeting the criteria to recognize revenue under ASC Topic 606. We have determined that all of our students can be grouped into one portfolio. Students behave similarly, regardless of their payment method. Enrollment agreements and refund policies are similar for all of our students. We do not expect that revenue earned for the portfolio is significantly different as compared to revenue that would be earned if we were to assess each student contract separately.
The Company maintains institutional tuition refund policies, which provides for all or a portion of tuition to be refunded if a student withdraws during stated refund periods. Certain states in which students reside impose separate, mandatory refund policies, which override the Company’s policy to the extent in conflict. If a student withdraws at a time when a portion or none of the tuition is refundable, then in accordance with its revenue recognition policy, the Company recognizes as revenue the tuition that was not refunded. Since the Company recognizes revenue pro-rata over the term of the course and because, under its institutional refund policy, the amount subject to refund is never greater than the amount of the revenue that has been deferred, under the Company’s accounting policies revenue is not recognized with respect to amounts that could potentially be refunded.
The Company had revenues from students outside the United States representing 1.48% and 1.32% of consolidated revenues for the three and nine months ended January 31, 2021, respectively. The Company had revenues from students outside the United States representing 1.90% of consolidated revenues for both the three and nine months ended January 31, 2020.
Note 9. Leases
We lease approximately 142,968 square feet of office and classroom space in the Phoenix (metropolitan area), San Diego, New York City, Denver, Austin, Tampa Bay and Moncton, New Brunswick Canada. The space in Austin, Texas and a portion of Tampa Bay, Florida commenced in January 2021.
Operating lease assets are right of use assets ("ROU assets"), which represent the right to use an underlying asset for the lease term. Operating lease liabilities represent the obligation to make lease payments arising from the lease. Operating leases are
ASPEN GROUP, INC. AND SUBSIDIARIES
CONDENSED NOTES TO CONSOLIDATED FINANCIAL STATEMENTS
January 31, 2021
(Unaudited)
included in "Operating lease right of use assets, net", "Operating lease obligations, current portion" and "Operating lease obligations, less current portion" in the consolidated balance sheet at January 31, 2021. These assets and lease liabilities are recognized based on the present value of remaining lease payments over the lease term. When the lease does not provide an implicit interest rate, the Company uses an incremental borrowing rate of 12% to determine the present value of the lease payments. Lease incentives are deducted from the right of use assets. Lease expense for operating leases is recognized on a straight-line basis over the lease term. There are no variable lease payments. Lease expense for the three and nine month period ended January 31, 2021 was $717,664 and $1,779,317, included in general and administrative expenses in the consolidated statements of operations, respectively.
ROU assets is summarized below:
| | | | | | | | |
| | January 31, 2021 |
| Operating office leases | | $ | 16,659,886 | |
| Less accumulated reduction | | (5,545,120) | |
| Total ROU assets | | $ | 11,114,766 | |
Operating lease obligations, related to the ROU assets is summarized below:
| | | | | | | | |
| | January 31, 2021 |
| Operating office leases | | $ | 17,673,056 | |
| Total lease liabilities | | 17,673,056 | |
| Reduction of lease liabilities | | (5,602,554) | |
| Total operating lease obligations | | $ | 12,070,502 | |
The following is a schedule by fiscal years of future minimum lease payments required under operating leases that have initial or remaining non-cancelable lease terms in excess of one year as of January 31, 2021 (a).
| | | | | | | | |
| Maturity of Lease Obligations | | Lease Payments |
| 2021 (remaining) | | $ | 801,080 | |
| 2022 | | 3,484,232 | |
| 2023 | | 2,867,030 | |
| 2024 | | 2,666,619 | |
| 2025 | | 2,371,491 | |
| 2026 and beyond | | 9,286,125 | |
| Total future minimum lease payments | | 21,476,577 | |
| Less imputed interest | | (9,406,075) | |
| Present value of operating lease obligations | | $ | 12,070,502 | |
_____________________
(a) Lease payments exclude legally binding minimum lease payments for campus leases signed but not yet commenced for the following locations: $5.2 million remaining in Tampa, Florida and $3.9 million in Phoenix, Arizona.
| | | | | | | | |
| Balance Sheet Classification | | |
| Operating lease obligations, current | | $ | 2,102,209 | |
| Operating lease obligations, long-term | | 9,968,293 | |
| Total operating lease obligations | | $ | 12,070,502 | |
| | | | | | | | |
| Other Information | | |
| Weighted average remaining lease term (in years) | | 7.24 |
| Weighted average discount rate | | 12.00 | % |
Note 10. Commitments and Contingencies
ASPEN GROUP, INC. AND SUBSIDIARIES
CONDENSED NOTES TO CONSOLIDATED FINANCIAL STATEMENTS
January 31, 2021
(Unaudited)
Employment Agreements
From time to time, the Company enters into employment agreements with certain of its employees. These agreements typically include bonuses, some of which may or may not be performance-based in nature.
Legal Matters
From time to time, we may be involved in litigation relating to claims arising out of our operations in the normal course of business. As of January 31, 2021, except as discussed below, there were no other pending or threatened lawsuits that could reasonably be expected to have a material effect on the results of our consolidated operations and there are no proceedings in which any of our directors, officers or affiliates, or any registered or beneficial shareholder, is an adverse party or has a material interest adverse to our interest.
On February 11, 2013, Higher Education Management Group, Inc. (“HEMG”), and its Chairman, Mr. Patrick Spada, sued the Company, certain senior management members and our directors in state court in New York seeking damages arising principally from (i) allegedly false and misleading statements in the filings with the Securities and Exchange Commission (the “SEC”) and the DOE where the Company disclosed that HEMG and Mr. Spada borrowed $2.2 million without board authority, (ii) the alleged breach of an April 2012 agreement whereby the Company had agreed, subject to numerous conditions and time limitations, to purchase certain shares of the Company from HEMG, and (iii) alleged diminution to the value of HEMG’s shares of the Company due to Mr. Spada’s disagreement with certain business transactions the Company engaged in, all with Board approval.
On December 10, 2013, the Company filed a series of counterclaims against HEMG and Mr. Spada in the same state court of New York. By order dated August 4, 2014, the New York court denied HEMG and Spada’s motion to dismiss the fraud counterclaim the Company asserted against them.
While the Company has been advised by its counsel that HEMG’s and Spada’s claims in the New York lawsuit is baseless, the Company cannot provide any assurance as to the ultimate outcome of the case. Defending the lawsuit maybe expensive and will require the expenditure of time which could otherwise be spent on the Company’s business. While unlikely, if Mr. Spada’s and HEMG’s claims in the New York litigation were to be successful, the damages the Company could pay could potentially be material.
In November 2014, the Company and Aspen University sued HEMG seeking to recover sums due under two 2008 Agreements where Aspen University sold course materials to HEMG in exchange for long-term future payments. On September 29, 2015, the Company and Aspen University obtained a default judgment in the amount of $772,793. This default judgment precipitated the bankruptcy petition discussed in the next paragraph.
On October 15, 2015, HEMG filed bankruptcy pursuant to Chapter 7. As a result, the remaining claims and Aspen’s counterclaims in the New York lawsuit are currently stayed. The bankrupt estate’s sole asset consisted of 208,000 shares of AGI common stock, plus a claim filed by the bankruptcy trustee against Spada’s brother and a third party to recover approximately 167,000 shares. On February 8, 2019, the bankruptcy court issued an order reducing AGI’s claim to $888,638 which consisted of the judgment and a $200,000 claim for failure to disclose certain liabilities. Subsequently, the trustee sold the AGI common stock and has $924,486 available for distribution. However, priorities are an unknown amount of income taxes due from the sale of the common stock, and as of June 2, 2020 $346,480 in fees due the trustee and his counsel and $574,145 due arising from settlements with the secured creditor and Spada’s brother and the third party. While we do not know how much the Company will receive, it will be substantially less than the judgement due.
Regulatory Matters
The Company’s subsidiaries, Aspen University and United States University, are subject to extensive regulation by Federal and State governmental agencies and accrediting bodies. In particular, the Higher Education Act (the “HEA”) and the regulations promulgated thereunder by the DOE subject the subsidiaries to significant regulatory scrutiny on the basis of numerous standards that schools must satisfy to participate in the various types of federal student financial assistance programs authorized under Title IV of the HEA.
ASPEN GROUP, INC. AND SUBSIDIARIES
CONDENSED NOTES TO CONSOLIDATED FINANCIAL STATEMENTS
January 31, 2021
(Unaudited)
On August 22, 2017, the DOE informed Aspen University of its determination that the institution has qualified to participate under the HEA and the Federal student financial assistance programs (Title IV, HEA programs) and set a subsequent program participation agreement reapplication date of March 31, 2021. The institution will submit its recertification application by March 31, 2021.
USU currently has provisional certification to participate in the Title IV Programs due to its acquisition by the Company. The provisional certification allows the school to continue to receive Title IV funding as it did prior to the change of ownership. The provisional certification expired on December 31, 2020. While the institution submitted its recertification application timely in October 2020, the DOE has not issued its final certification. The institution is able to continue operating under its current participation agreement until the DOE issues its recertification.
The HEA requires accrediting agencies to review many aspects of an institution's operations in order to ensure that the education offered is of sufficiently high quality to achieve satisfactory outcomes and that the institution is complying with accrediting standards. Failure to demonstrate compliance with accrediting standards may result in the imposition of probation, the requirements to provide periodic reports, the loss of accreditation or other penalties if deficiencies are not remediated.
Because our subsidiaries operate in a highly regulated industry, each may be subject from time to time to audits, investigations, claims of noncompliance or lawsuits by governmental agencies or third parties, which allege statutory violations, regulatory infractions or common law causes of action.
Title IV Funding
Aspen University and United States University derive a portion of their revenues from financial aid received by its students under programs authorized by Title IV of the Higher Education Act ("HEA"), which are administered by the US Department of Education. When Aspen University students seek funding from the federal government, they receive loans and grants to fund their education under the following Title IV Programs: (1) the Federal Direct Loan program, or Direct Loan; (2) the Federal Pell Grant program, or Pell; (3) Federal Work Study and (4) Federal Supplemental Opportunity Grants. For the fiscal year ended April 30, 2020, approximately 31% of Aspen University’s and 33% for United States University's cash-basis revenues for eligible tuition and fees were derived from Title IV Programs.
Return of Title IV Funds
An institution participating in Title IV Programs must correctly calculate the amount of unearned Title IV Program funds that have been disbursed to students who withdraw from their educational programs before completion and must return those unearned funds in a timely manner, no later than 45 days of the date the school determines that the student has withdrawn. Under the DOE regulations, failure to make timely returns of Title IV Program funds for 5% or more of students sampled on the institution's annual compliance audit in either of its two most recently completed fiscal years can result in the institution having to post a letter of credit in an amount equal to 25% of its required Title IV returns during its most recently completed fiscal year. If unearned funds are not properly calculated and returned in a timely manner, an institution is also subject to monetary liabilities or an action to impose a fine or to limit, suspend or terminate its participation in Title IV Programs.
On September 28, 2020, the DOE notified USU that the funds held for a letter of credit in the amount of $255,708, based on the audited same day balance sheet requirements that apply in a change of control, which was funded by the University’s sole shareholder, AGI, were released. In August 2020, the DOE informed USU that it is required to post a new letter of credit in the amount of $379,345, based on the current level of Title IV funding. This irrevocable letter of credit was to expire on August 25, 2021. Pursuant to USU’s provisional Program Participation Agreement ("PPA"), the DOE indicated that USU must agree to participate in Title IV under the HCM1 funding process; however, the DOE does retain discretion on whether or not to implement that term of the agreement. Although DOE has not, to date, notified USU that it has been placed in the HCM1 funding process, nor does the DOE’s public disclosure website identify USU as being on HCM1, it is possible that prior to the end of the PPA term, the DOE may notify USU that it must begin funding under the HCM1 procedure. If this occurs, the Company believes this will not have a material impact on the consolidated financial statements. In December 2020, the DOE released the existing USU letter of credit of $369,473, which was required to be posted based on the level of Title IV funding. In connection with USU's most recent Compliance Audit, USU maintains a letter of credit of $9,872 at January 31, 2021.
ASPEN GROUP, INC. AND SUBSIDIARIES
CONDENSED NOTES TO CONSOLIDATED FINANCIAL STATEMENTS
January 31, 2021
(Unaudited)
Approval to Confer Degrees
Aspen University is a Delaware corporation and is approved to operate in the State of Delaware. Aspen University is authorized by the Colorado Commission on Education in the State of Colorado and the Arizona State Board for Private Post-Secondary Education in the State of Arizona to operate as a degree granting institution for all degrees. Aspen University is authorized to operate as a degree granting institution for bachelor degrees by the Texas Higher Education Coordinating Board in the State of Texas. Aspen University has been granted Optional Expedited Authorization as a postsecondary educational institution in Tennessee for its Bachelor of Science in Nursing (Pre-licensure) degree program. Aspen University has received a Provisional License for its Bachelor of Science in Nursing (Pre-licensure) degree program to operate in the state of Florida by the Commission for Independent Education of the Florida Department of Education and is in the process for full licensure.
USU is also a Delaware corporation and received initial approval from the Delaware DOE to confer degrees through June 2023. United States University is authorized by the California Bureau of Private Postsecondary Education and the Arizona State Board for Private Post-Secondary Education to operate as degree granting institutions for all degrees.
Note 11. Subsequent Events
On March 8, 2021, the Company announced that Aspen University received the final required state and board of registered nursing regulatory approvals for their new Pre-Licensure Bachelor of Science in Nursing (BSN) campus in Nashville, Tennessee, with permission to commence marketing and begin to enroll first-year prerequisite students effective immediately. Aspen University is targeting to begin its initial (years 2-3) core program semester in Nashville in August, 2021, in clinical partnership with HCA Healthcare TriStar Division, NorthCrest Medical Center, Nashville General Hospital, among others.
On February 25, 2021, Frank J. Cotroneo, former Chief Financial Officer and director of the Company, resigned from his positions as an officer and director of the Company and terminated his employment with the Company. His departure was effective February 26, 2021. In connection with Mr. Cotroneo’s resignation, the Company entered into a Confidential Severance Agreement with Mr. Cotroneo (the “Agreement”). Mr. Controneo’s Employment Agreement terminated upon execution of the Agreement. Under the Agreement, Mr. Cotroneo will receive severance of $150,000, $18,563 as a final bonus for fiscal year 2020, $33,750 as a final bonus for fiscal year 2021, and up to $96,250 as reimbursement for relocation costs which the Company had previously agreed to in order to induce Mr. Cotroneo to move. For six months, the Company agreed to pay Mr. Cotroneo’s health insurance and related costs. In addition, the Company agreed to the automatic vesting of 13,892 unvested non-qualified stock options exercisable at $5.12 and the automatic vesting of 80,251 restricted stock units. The remaining 48,750 price based restricted stock units terminated. The Board of Directors of the Company appointed Robert Alessi, who had been serving as the Chief Accounting Officer of the Company, to serve as the Company’s Chief Financial Officer on an interim basis effective immediately. Mr. Alessi’s compensatory arrangements did not change in connection with his appointment as the Company’s Interim Chief Financial Officer.
On February 8, 2021, the Company provided written notice to Canaccord Genuity of its election to terminate the Equity Distribution Agreement. This action terminates the Company’s at-the-market offering facility effective February 18, 2021.
ITEM 2. MANAGEMENT’S DISCUSSION AND ANALYSIS OF FINANCIAL CONDITION AND RESULTS OF OPERATIONS.
You should read the following discussion in conjunction with our unaudited consolidated financial statements, which are included elsewhere in this Form 10-Q. This Quarterly Report on Form 10-Q contains forward-looking statements that reflect our plans, estimates, and beliefs. Our actual results could differ materially from those discussed in the forward-looking statements. See "Cautionary Note Regarding Forward Looking Statements" for more information.
Key Terms
In connection with the management of our businesses, we identify, measure and assess a variety of operating metrics. The principal metrics we use in managing our businesses are set forth below:
Operating Metrics
•Lifetime Value ("LTV") - Lifetime Value as the weighted average total amount of tuition and fees paid by every new student that enrolls in the Company’s universities, after giving effect to attrition.
•Bookings - defined by multiplying LTV by new student enrollments for each operating unit.
•Average Revenue per Enrollment ("ARPU") - defined by dividing total bookings by total enrollments for each operating unit.
•Marketing Efficiency Ratio ("MER") - is defined as revenue per enrollment divided by cost per enrollment.
Operating costs and expenses
•Cost of revenues - consists of instructional costs and services and marketing and promotional costs.
◦Instructional costs - consist primarily of costs related to the administration and delivery of the Company's educational programs. This expense category includes compensation costs associated with online faculty, technology license costs and costs associated with other support groups that provide services directly to the students and are included in cost of revenues.
◦Marketing and promotional costs - include costs associated with producing marketing materials and advertising, and outside sales costs. Such costs are generally affected by the cost of advertising media, the efficiency of the Company's marketing and recruiting efforts, and expenditures on advertising initiatives for new and existing academic programs. Non-direct response advertising activities are expensed as incurred, or the first time the advertising takes place, depending on the type of advertising activity.
•General and administrative expense - consists primarily of compensation expense (including stock-based compensation expense) and other employee-related costs for personnel engaged in executive and academic management and operations, finance, legal, tax, information technology and human resources, fees for professional services, financial aid processing costs, non-capitalizable courseware and software costs, corporate taxes and facilities costs.
Non-GAAP financial measures:
•Adjusted Net Income (Loss) and Adjusted Earnings (Loss) per Share - are non-GAAP financial measures. See "Non-GAAP – Financial Measures" for a reconciliation of net earnings (loss) and earnings (loss) per share to Adjusted Net Income (Loss) and Adjusted Earnings (Loss) per Share for the three and nine months ended January 31, 2021 and 2020.
•Earnings Before Interest, Taxes, Depreciation and Amortization ("EBITDA") - is a non-GAAP financial measure. See "Non-GAAP – Financial Measures" for a reconciliation of net loss to EBITDA for the three and nine months ended January 31, 2021 and 2020.
•Adjusted Earnings Before Interest, Taxes, Depreciation and Amortization ("Adjusted EBITDA") - is a non-GAAP financial measure. See "Non-GAAP – Financial Measures" for a reconciliation of net loss to Adjusted EBITDA for the three and nine months ended January 31, 2021 and 2020.
AGI Student Population Overview
AGI’s overall active student body (includes both Aspen University and USU) grew 22% year-over-year from 11,033 to 13,407 as of January 31, 2021 and students seeking nursing degrees were 11,636 or 87% of the total active students at both universities. Of the 11,636 students seeking nursing degrees, 9,277 are Registered Nurses studying to earn an advanced degree, while the remaining 2,359 nursing students are enrolled in Aspen University’s BSN Pre-Licensure program in the Phoenix, Austin and Tampa metros.
Aspen University’s total active degree-seeking student body grew 17% year-over-year from 9,274 to 10,863. On a year-over-year basis, USU’s total active student body grew from 1,759 to 2,544 or 45%. Active student body is comprised of active degree-seeking students, enrolled in a course at the end of the third quarter of fiscal year 2021 or are registered for an upcoming course.
Company Overview
AGI is an education technology holding company. It operates two universities, Aspen University ("Aspen University" or "Aspen") and United States University ("United States University" or "USU").
All references to the “Company”, “AGI”, “Aspen Group”, “we”, “our” and “us” refer to Aspen Group, Inc., unless the context otherwise indicates.
AGI leverages its education technology infrastructure and expertise to allow its two universities, Aspen University and United States University, to deliver on the vision of making college affordable again. Because we believe higher education should be a catalyst to our students’ long-term economic success, we exert financial prudence by offering affordable tuition that is one of the greatest values in higher education. AGI’s primary focus relative to future growth is to target the high growth nursing profession. As of January 31, 2021, 11,636 of 13,407 or 87% of all active students across both universities are degree-seeking nursing students. Of the 11,636 students seeking nursing degrees, 9,277 are Registered Nurses (RNs) studying to earn an advanced degree, while the remaining 2,359 nursing students are enrolled in Aspen University’s BSN Pre-Licensure program in the Phoenix, Austin and Tampa metros.
In March 2014, Aspen University unveiled a monthly payment plan available to all students across every online degree program offered by the university. The monthly payment plan is designed so that students will make one payment per month, and that monthly payment is applied towards the total cost of attendance (tuition and fees, excluding textbooks). The monthly payment plan offers online associate and most bachelor students the opportunity to pay their tuition and fees at $250/month, online master students $325/month, and online doctoral students $375/month, interest free, thereby giving students a monthly payment option versus taking out a federal financial aid loan.
USU began offering monthly payment plans in the summer of 2017. Today, monthly payment plans are available for the online RN to BSN program ($250/month), online MBA/M.A. Ed/MSN programs ($325/month), hybrid Bachelor of Arts in Liberal Studies, Teacher Credentialing tracks approved by the California Commission on Teacher Credentialing ($350/month), and the online hybrid Masters of Nursing-Family Nurse Practitioner (“FNP”) program ($375/month). Since August 1, 2019, new student enrollments for USU’s FNP monthly payment plan have been offered a $9,000 two-year payment plan ($375/month x 24 months) designed to pay for the first year’s pre-clinical courses only. The second academic year of the two-year FNP
program in which students complete their clinical courses (approximate cost of $18,000) is required to be funded through conventional payment methods (either cash, private loans, corporate tuition reimbursement or federal financial aid).
Since 1993, Aspen University has been nationally accredited by the DEAC, a national accrediting agency recognized by the DOE and CHEA. On February 25, 2019, the DEAC informed Aspen University that it had renewed its accreditation for five years to January 2024.
Since 2009, USU has been regionally accredited by WSCUC.
Both universities are qualified to participate under the Higher Education Act and the Federal student financial assistance programs (Title IV, HEA programs).
AGI New Student Enrollments
In the third quarter of fiscal year 2021, student enrollments increased 22% year-over-year to 2,129. Aspen University generated 1,593 new student enrollments, up 16% year-over-year, attributable to strength in its Doctoral and Nursing + Other units. Aspen's BSN Pre-Licensure program also experienced strong growth from our recently launched campuses in Tampa and Austin given the tailwind of millennials looking for better paying, secure jobs. As previously disclosed, the Company intentionally slowed year-over-year enrollment growth at our Phoenix pre-licensure campuses. These campuses currently have a full pipeline of first-year online pre-requisite students. This decision moderated pre-licensure enrollment growth in the quarter to 15%.
USU delivered 536 new student enrollments, a 43% increase year-over-year, primarily from MSN-Family Nurse Practitioner (“FNP”) enrollments. The FNP enrollment growth is especially notable, given the demands on nursing professionals with COVID-19 infection rates accelerating throughout the past several months.
Below is a table reflecting new student enrollments for the past five quarters:
| | | | | | | | | | | | | | | | | | | | | | | | | | | | | | | | |
| | New Student Enrollments |
| | Q3'20 | | Q4'20 | | Q1'21 | | Q2'21 | | Q3'21 |
| Aspen University | | 1,371 | | | 1,344 | | | 1,779 | | | 2,010 | | | 1,593 | |
| USU | | 375 | | | 432 | | | 572 | | | 649 | | | 536 | |
| Total | | 1,746 | | | 1,776 | | | 2,351 | | | 2,659 | | | 2,129 | |
Marketing Efficiency Ratio (MER) Analysis
AGI has developed a marketing efficiency ratio to continually monitor the unit economic performance of its business model.
| | | | | |
| Marketing Efficiency Ratio (MER) = | Revenue per Enrollment (RPE) |
| Cost per Enrollment (CAC) |
Cost per Enrollment (CAC) (previously referred to as CPE)
The Cost per Enrollment measures the advertising investment spent in a given nine month period, divided by the number of new student enrollments achieved in that given nine month period, in order to obtain an average CAC.
Revenue per Enrollment (RPE)
The Revenue per Enrollment takes each quarterly cohort of new degree-seeking student enrollments, and measures the amount of earned revenue on a weighted average basis, including tuition and fees to determine the weighted average RPE for the cohort measured. For the later periods of a cohort, we have used reasonable projections based off of historical results to determine the amount of revenue we will earn in later periods of the cohort.
In the third quarter of fiscal year 2021 the Marketing Efficiency Ratio (MER) for our universities remained above 11X, representing revenue-per-enrollment (LTV) over cost-per-enrollment (CAC), as shown in the table below:
| | | | | | | | | | | | | | | | | | | | | | | | | | | | | |
| Third Quarter Marketing Efficiency Ratio |
| Enrollments | | CAC1 | | LTV2 | | Q3 '21 MER | | Q3 '20 MER |
| Aspen University | 1,593 | | | $ | 1,296 | | | $ | 14,737 | | 3 | 11.4X | | 15.1X |
| USU | 536 | | | $ | 1,574 | | | $ | 17,820 | | 4 | 11.3X | | 16.2X |
_____________________
1 Based on 6-month rolling weighted average CAC for each university’s enrollments
2 Weighted Lifetime Value (LTV) of a new student enrollment
3 Weighted average LTV for all Aspen University enrollments in the quarter
4 LTV for USU’s MSN-FNP Program
Compared to the prior year period, AGI’s weighted average cost of enrollment (CAC) increased 38%, from $989 to $1,365, as expected, given the Company launched marketing in two new metros and materially increased marketing spending the past two quarters and there has historically been a one to two quarter lag effect in increased marketing investment to revenue. See the table below.
| | | | | | | | | | | | | | | | | | | | | | | | | | | | | |
| Third Quarter Weighted Average Cost of Enrollment |
| Q3 '20 Enrollments | | Q3'20 CAC1 | | Q3'21 Enrollments | | Q3'21 CAC1 | | CAC % Change |
| Aspen University | 1,371 | | | $ | 961 | | | 1,593 | | | $ | 1,296 | | | 35 | % |
| USU | 375 | | | $ | 1,103 | | | 536 | | | $ | 1,574 | | | 43 | % |
| Weighted Average | | | $ | 989 | | | | | $ | 1,365 | | | 38 | % |
_____________________
1Based on 6-month rolling average
Bookings Analysis and ARPU
On a year-over-year basis, fiscal third quarter 2021 Bookings increased 24% to $33.0 million. The increase in Bookings led to a company-wide average revenue per enrollment (ARPU) increase by 2% to $15,513, reflecting the shift in the revenue mix toward higher LTV nursing licensure degree programs, partially offset by the planned flattening of first-year online pre-requisite student enrollments at the Phoenix BSN pre-licensure campuses.
| | | | | | | | | | | | | | | | | | | | | | | | | | | | | |
| Third Quarter Bookings and Average Revenue Per Enrollment (ARPU) |
| Q3'20 Enrollments | | Q3'20 Bookings 1 | | Q3'21 Enrollments | | Q3'21 Bookings 1 | | Percent Change Total Bookings & ARPU 1 |
| Aspen University | 1,371 | | | $ | 19,855,050 | | | 1,593 | | | $ | 23,476,050 | | | |
| USU | 375 | | | $ | 6,682,500 | | | 536 | | | $ | 9,551,520 | | | |
| Total | 1,746 | | | $ | 26,537,550 | | | 2,129 | | | $ | 33,027,570 | | | 24 | % |
| ARPU | | | $ | 15,199 | | | | | $ | 15,513 | | | 2 | % |
_____________________
1 “Bookings” are defined by multiplying Lifetime Value (LTV) by new student enrollments for each operating unit. “Average Revenue Per Enrollment” (ARPU) is defined by dividing total Bookings by total new student enrollments for each operating unit.
ASPEN UNIVERSITY’S PRE-LICENSURE BSN HYBRID (ONLINE/ON-CAMPUS) DEGREE PROGRAM
In July 2018, Aspen University through Aspen Nursing of Arizona, Inc. began its Pre-Licensure Bachelor of Science in Nursing degree program at its initial campus in Phoenix, Arizona. As a result of overwhelming demand in the Phoenix metropolitan area, in January 2019 Aspen University began offering both day (July, November, March semesters) and evening/weekend (January, May, September semesters) programs, equaling six semester starts per year. Moreover, in September 2019, Aspen University opened a second campus in the Phoenix metropolitan area in partnership with HonorHealth.
Aspen University’s innovative hybrid (online/on-campus) program allows most of the credits to be completed online (83 of 120 credits or 69%), with pricing offered at current low tuition rates of $150/credit hour for online general education courses and $325/credit hour for online core nursing courses. For students with no prior college credits, the total cost of attendance is less than $50,000.
Aspen University’s BSN Pre-Licensure program is offered as a full-time, three-year (nine semester) program that is specifically designed for students who do not currently hold a state nursing license and have no prior nursing experience. Aspen University is admitting students into one of two program components: (1) a pre-professional nursing (PPN) component for students that have less than the required 41 general education credits completed (Year 1), and (2) the nursing core component for students that are ready to participate in the competitive evaluation process for entry (Years 2-3).
On the February 2, 2021 semester start date, Aspen University implemented its first double cohort enrollment at its main campus in Phoenix. Fifty-seven students entered the core BSN-PL program at the Main Campus, in two cohorts of 29 and 28, respectfully. Additionally, 29 students entered the program at the HonorHealth campus, bringing the total two-year core program semester starts in February, 2021 to 86 students, an increase of over 70% from the prior year period for this program in the Phoenix metro. Aspen University implements six semester start dates per annum in Arizona. With the introduction of double cohorts at its main campus in Phoenix, the university is on pace to start over 500 students per annum into the final two-year core program, up from the prior run rate of approximately 300 students. Given the revenue per student for the final two-year core program is approximately $20,000 per annum, that equates to an approximate $10 million revenue run rate per annum in the Phoenix metro, up from approximately $6 million with single cohorts, excluding revenues earned from over 1,750 first-year online pre-requisite students currently enrolled.
Pre-Licensure BSN Program - Campus Expansion
Tampa, Florida Campus
Aspen University has executed a definitive lease agreement for ten years to occupy approximately 30,000 square feet (Suites 150 and 450) of the Tampa Oaks I property located at 12802 Tampa Oaks Boulevard. The building is visible from the intersection of Interstate 75 and East Fletcher Avenue, near the University of South Florida, providing visibility to approximately 126,500 cars per day. Aspen University's initial PPN nursing student enrollments began on the December 8, 2020 semester start date.
Aspen University has executed an agreement with Bayfront Health, a regional network of seven hospitals and over 1,900 medical professionals on staff serving the residents of Florida’s Gulf Coast to provide required clinical placements for Aspen’s nursing students. In addition, clinical affiliation agreements have been signed in the Tampa metropolitan area with John Hopkins All Children’s Hospital, Inc., Care Connections at Home, Global Nurse Network, LLC and The American National Red Cross.
Austin, Texas Campus
Aspen University has executed a definitive lease agreement for eight years to occupy approximately 22,000 square feet in a portion of the first floor of the Frontera Crossing office building located at 101 W. Louis Henna Boulevard in the Austin suburb of Round Rock. The building is situated at the junction of Interstate 35 and State Highway 45, one of the most heavily trafficked freeway exchanges in the metropolitan area with visibility to approximately 143,000 cars per day. Regulatory approvals were completed in July 2020 and marketing has begun in the Austin metropolitan area.
Aspen has executed a clinical affiliation agreement with Baylor Scott & White Health – Central division, the largest not-for-profit healthcare system in Texas and one of the largest in the United States. Baylor Scott & White includes 48 hospitals, more than 800 patient care sites, more than 7,800 active physicians, over 47,000 employees and the Scott & White Health Plan.
In addition to the Round Rock campus, effective August 1, 2020, Aspen University executed a sublease to take over the remaining 20-month lease held by sublandlord National American University (NAU) to occupy approximately 7,200 square feet of their campus in the suburb of Georgetown, Texas, which is approximately 10 miles north of Aspen’s future Frontera Crossing campus in the suburb of Round Rock. In exchange, Aspen as subtenant, at no additional cost, shall have the right to utilize all the existing furniture, fixtures and equipment owned by sublandlord and the sublandlord will convey all such furniture, fixtures and equipment to subtenant via a bill of sale for $10.00. Aspen University's initial PPN nursing student enrollments began on the September 29, 2020 semester start date.
Nashville, Tennessee Campus
On March 8, 2021, the Company announced that Aspen University received the final required state and board of registered nursing regulatory approvals for their new Pre-Licensure Bachelor of Science in Nursing (BSN) campus in Nashville, Tennessee, with permission to commence marketing and begin to enroll first-year PPN students effective immediately. Aspen University is targeting to begin its initial (years 2-3) core program semester in Nashville in August, 2021.
The Nashville campus will be located at 1809 Dabbs Avenue, which is situated right on Interstate 40 east of downtown Nashville, four miles west of the Nashville airport. Clinical affiliation agreements have been executed with NorthCrest Medical Center, Trust Point Hospital, and Nashville General Hospital, among others.
AGI’s Plan for United States University (USU) to Implement MSN-FNP Weekend Immersions in Every Campus Metropolitan Area:
While lab hours to date have been done at USU’s San Diego facility, the rapid growth of the MSN-FNP program has caused AGI to plan to expand the lab immersions in multiple locations across the United States. For example, the Company has leased an additional suite on the ground floor of our main campus facility in Phoenix (by the airport) to begin offering weekend immersions for MSN-FNP students in both San Diego and Phoenix. We expect this additional clinical facility in Phoenix, as well as the Tampa campus clinical facility to be open at the end of this calendar year, for a total of three clinical facilities available for MSN-FNP weekend immersions scheduled to start in the current quarter ending April 30, 2021.
AGI’s Tele-Health Affiliation Partnership with American-Advanced Practice Network (A-APN)
On July 7, 2020, the Company announced an affiliation partnership with American-Advanced Practice Network (A-APN), a national clinical network for advanced practice nurses that provides comprehensive health care and nursing services at its outpatient centers and clinical facilities throughout the U.S.
A-APN offers independent nurse practitioners (NPs) a unique, multi-state network or "group practice without walls" with best-in-class technology and business support. A-APN was created for and by NPs. Rural and remote members of the network have nationwide, trusted peer cross-coverage for patients. A-APN members deliver clinical care using CareSpan's Digital Care Delivery platform, facilitating care delivery in-person, or at a distance. The platform includes diagnostics, EMR, e-prescribing, remote monitoring, and dynamic documentation.
Through this affiliation, A-APN will appoint an Educational Coordinator to work with USU’s Office of Field Experience to place USU MSN-FNP students with qualified, experienced NP preceptors. We expect that this telehealth partnership will enable MSN-FNP students to complete their required direct care clinical hours with A-APN throughout the COVID-19 crisis and thereafter.
ACCOUNTS RECEIVABLE AND MONTHLY PAYMENT PLAN
The Company’s accounts receivable over the last several years has predominantly been a result of our groundbreaking monthly payment plan (or MPP) which we introduced in 2014 at Aspen University and subsequently in 2018 at United States University.
Since the beginning of fiscal year 2021, the monthly payment plan accounts receivable balance, both short-term and long-term, has increased by approximately $5.3 million. The attractive aspect of being able to pay for a degree over a fixed period of time has fueled the growth of this plan.
Each student’s receivable account is different depending on how many classes a student takes each period. If a student takes two classes each eight-week period while paying $250, $325 or $375 a month, that student’s account receivable balance will rise accordingly.
The common thread is the actual monthly payment, which functions as a retail installment contract with no interest that each student commits to pay over a fixed number of months. Aspen University students paying tuition and fees through a monthly payment method grew by 11% year-over-year, from 5,966 to 6,652, representing 61% of Aspen University’s total active student body.
USU students paying tuition and fees through a monthly payment method grew 36% year-over-year, from 1,159 to 1,582, representing 62% of USU’s total active student body.
In history, we have issued approximately $70 million of credit to Aspen University’s MPP students, and to date, we have written off $631,000 or approximately 1% of that accounts receivable. Bad debt reserve for this accounts receivable is currently $2.5 million which we believe is conservative because our current collection history and analysis suggests that we will not ultimately need to write-off more than about 2.5% of that $70 million or a total or $1.8 million which includes the $631,000 written off to date.
USU’s MPP program had previously offered nurse practitioner students a 6-year MPP plan, offered from 2018 to 2019. The majority of the Company’s increase of accounts receivable this fiscal year is related to that MPP plan. Specifically, the
Company’s long-term accounts receivable during the first nine months of this fiscal year increased from $6.7 million to $9.9 million with USU accounting for 83% of that increase. The Company’s short-term accounts receivable during the nine month period of this fiscal year increased from $16.1 million to $18.8 million with USU accounting for 70% of that increase.
While the majority of the accounts receivable increase for the Company in the past year has been through issuing credit to Nurse Practitioner students at USU, the collection history of these FNP students is tracking materially better than the Company's collection history of Aspen University MPP students. From 2018 to 2019, the Company issued approximately $17 million of credit to USU FNP students on the six year payment plan. The Company has collected to date $8.3 million of that $17 million, so the remaining accounts receivable is approximately $8.7 million.
The total student count that makes up the $8.7 million of USU FNP MPP student accounts receivable is approximately 800 students; 44% of those 800 students have graduated, while 50% remain active students today in the university, and the remaining 6% are no longer enrolled. Of those 800 students, the Company currently has 43 students that have not made a recent monthly payment which accounts for total accounts receivable of $205,000 or 1.2% of the total credit issued to date. In other words, the Company is estimating this 6-year MPP accounts receivable to perform materially better than Aspen University's MPP history which has performed well to date.
Change in Business Mix and Relationship to Accounts Receivable
During the third quarter of fiscal year 2021, revenue from students using the Monthly Payment Plan increased by approximately 24.3% year over year, but declined as a percentage of total revenue for the second year in a row down from approximately 53.1% in Q3 Fiscal 2020 to 49.8% in Q3 Fiscal 2021, while total revenue increased 33% year over year.
Our highest lifetime value business unit is Aspen University’s Pre-Licensure BSN business. This is our fastest growing business unit and now represents 22% of total annual revenue. We expect the revenue from this unit to continue to grow as a percentage of our total revenue as we continue to expand our campus footprint from 4 to over 12 campuses over the next 4 years.
This change in our business mix is expected to have a meaningful impact on our accounts receivable and our allowance for doubtful accounts. The BSN Pre-Licensure program requires payment prior to the start of each term. This means that nearly 100% of all revenue from this program will be paid in advance; meaningfully reducing our accounts receivable and the allowance for doubtful accounts as a percentage of our total revenue.
As revenue from this program continues to grow as a percentage of overall revenue, we expect that we will see a corresponding increase in our cash flows from operations that in turn will allow AGI to turn cash flow positive and generate positive free cash flow over time.
In addition to this change in our business mix, we continue to evolve the analysis of our accounts receivable and expanded our analysis to include evaluation of all payment types, student status, and aging within programs. As we upgrade our financial systems we expect to gain greater ability to track discrete data faster and easier to support more proactive student engagement that we believe will improve the performance of our student receivable portfolio.
As we identify program and student status specific trends, we will strive to create ways to isolate program specific revenue and accounts receivable activity to gather, analyze and report program specific data and trends. Over time we will use this knowledge to enhance our allowance reserving policies going forward.
By improving visibility into trends earlier we expect to see improvement in overall student performance and a reduction of account delinquencies.
Reserving for Allowance for Doubtful Accounts and Charges to the Allowance
As part of the account receivable analysis discussed earlier, we evaluated our long-term MPP and other payment type student receivables. The analysis evaluated students in two categories: nursing and non-nursing. Based on our analysis of the payment details and student performance, in the fourth quarter of fiscal 2020, we elected to charge $152,000 of MPP receivables against the reserve for doubtful accounts. The MPP receivables will be evaluated in conjunction with our updated recovery and collection process and we expect results to be positive. For the nine months of fiscal 2021, no changes to the methodology were
made and approximately $500,000 of student accounts receivable were written off. The Company continues to review accounts receivable for reasonableness and impact on results of operations.
Our accounts receivable remaining for former students are from 2018 or more recent with the exception of certain alumni from our nursing programs. We believe our analysis is appropriate and reasonable. We further believe that we are positioned to focus our enhanced recovery and collections efforts on delinquencies and past due amounts from recent graduates and current enrolled students.
Based on our review of accounts receivable, overall revenue growth trends and changes in our mix of business, we evaluated our reserve methodology and increased our reserve by $610,000 for Aspen University and by $60,000 for USU in the third quarter of fiscal year 2021. Note that the AGI's bad debt allowance started the quarter at $2.52 million and ended the quarter at $2.92 million.
As part of the process of evaluating our reserving methodology we also evaluated our processes in student accounts, and our accounts receivable recovery and collections processes. We have designed an enhanced recovery and collections process that is expected to begin recovery of student late payments earlier and manage these students more proactively during their course of study and post-graduation for MPP students.
We will continue to reserve against our receivables based on revenue growth trends, mix of business and specific trends we identify on a program by program basis. We believe we currently have sufficient reserves against our current student portfolio but we intend to stay vigilant to become aware of external changes that could affect our students ability to meet their obligations such as the continuation of the COVID-19 economic slowdown or other exogenous events and circumstances that could give us reason to make a material change to our current methodology and reserve policy.
Overtime we expect the change in our mix of business together with process improvements and collection enhancements to result in a better managed portfolio of student receivables and improving cash flow from operations.
Relationship Between Accounts Receivable and Revenue
The gross accounts receivable balance for any period is the net effect of the following three factors:
1.Revenue;
2.Cash receipts; and
3.The net change in deferred revenue.
All three factors equally determine the gross accounts receivable. If one quarter experiences particularly high cash receipts, the gross accounts receivable will go down. The same effect happens if cash receipts are lower or if there are significant changes in either of the other factors.
Simply looking at the change in revenue does not translate into an equally similar change in gross accounts receivable. The relative change in cash and the deferral must also be considered. For net accounts receivable, the changes in the reserve must also be considered. Any additional reserve or write-offs will influence the balance.
As it is a straight mathematical formula for both gross accounts receivable and net accounts receivable, and most of the information is public, one can reasonably calculate the two non-public pieces of information, namely the cash receipts in gross accounts receivable and the write-offs in net accounts receivable.
For revenue, the quarterly change is primarily billings and the net impact of deferred revenue. The deferral from the prior quarter or year is added to the billings and the deferral at the end of the period is subtracted from the amount billed. The total deferred revenue at the end of every period is reflected in the liability section of the consolidated balance sheet. Deferred revenue can vary for many reasons, but seasonality and the timing of the class starts in relation to the end of the quarter will cause changes in the balance.
As mentioned in the accounts receivable discussion above, the change in revenue cannot be compared to the change in accounts receivable. Revenue does not have the impact of cash received whereas accounts receivable does. Depending on the month and the amount of cash received, it is likely that revenue or accounts receivable will increase at a rate different from the other. The impact of cash is easy to substantiate as it agrees to deposits in our bank accounts.
At January 31, 2021, the allowance for doubtful accounts was $2,924,887 which represents approximately 10% of the gross accounts receivable balance of $28,744,052, the sum of both short-term and long-term receivables.
Long-Term Accounts Receivable
When a student signs up for the monthly payment plan, there is a contractual amount that the Company can expect to earn over the life of the student’s program. This contractual amount cannot be recorded as an account receivable as the student does have the option to stop attending. As a student takes a class, revenue is earned over that eight-week class. Some students accelerate their program, taking two classes every eight-week period, and as we discussed, that increases the student’s accounts receivable balance. If any portion of that balance will be paid in a period greater than 12 months, that portion is reflected as long-term accounts receivable.
As a result of the growing acceptance of our monthly payment plans, our long-term accounts receivable balance has grown from $6,701,136 at April 30, 2020 to $9,986,613 at January 31, 2021. The primary components of MPP are students who make monthly payments over 36, 39 and 72 months. The average student completes their academic program in 30 months, therefore most of the Company’s accounts receivable are short-term. However, when students graduate earlier than the 30 month average completion duration, they transition to long-term accounts receivable. Those are the two primary factors that have driven an increase in long-term accounts receivable.
Here is a graphic of both short-term and long-term receivables, as well as contractual value:
| | | | | | | | |
| A | B | C |
| Payments owed for classes taken where payment plans for classes are less than 12 months, less monthly payments received | Payments owed for classes taken where payment plans are greater than 12 months | Expected classes
to be taken over
balance of program. |
Short-Term
Accounts Receivable | Long-term
Accounts Receivable | Not recorded in
financial statements |
| The Sum of A, B and C will equal the total cost of the program. |
Fiscal 2021 Developments
On September 14, 2020, after the closing price of our common stock was at least $10.725 over a 20 consecutive trading day period the $10 million Convertible Notes automatically converted into 1,398,602 shares of the Company’s common stock at a conversion price of $7.15 per share. The accelerated amortization charge related to unamortized debt discounts as a result of the debt extinguishment in the second quarter of fiscal year 2021 was approximately $1.4 million, which was included in interest expense in the consolidated statement of operations.
On August 31, 2020, the closing price of the Company’s common stock was at least $9 for 20 consecutive trading days, resulting in 10% or 37,500 of the February 4, 2020 RSU grants to executives vesting immediately. Additionally, on September 2, 2020, the Company’s common stock was at least $10 for 20 consecutive trading days and 25% or 93,750 of the RSUs granted vested immediately. On the grant date, the closing price of the Company's common stock on The Nasdaq Global Market was $9.49 per share. See Note 7 "Stockholders' Equity" in "Item 1. Financial Statements" for additional information on the vesting terms for these RSUs. The accelerated amortization expense related to this transaction in the second quarter of fiscal year 2021 was approximately $1.2 million for the vesting of these 131,250 RSUs, which is included in general and administrative expense in the consolidated statement of operations.
On August 31, 2020, the Company entered into an Equity Distribution Agreement (the “Agreement”) with Canaccord Genuity LLC (“Canaccord”), pursuant to which the Company may issue and sell from time to time, through Canaccord, up to $12,309,750 of shares of the Company’s common stock. The purpose of this Agreement is to allow the Company to sell common stock that has been surrendered from executive officers and director vesting events to pay their portion of withholding taxes as well as to pay the Company the strike price of options upon cashless exercise. As of the date of this filing, 449,632 shares of common stock have been sold under the Agreement for gross proceeds of $5,181,590. On February 8, 2021, the Company provided written notice to Canaccord of its election to the Agreement. This action terminates the Company’s at-the-market offering facility effective February 18, 2021.
On June 5, 2020, the Company, as an inducement to exercise, reduced by 5% the exercise price of the common stock purchase warrants issued to The Leon and Toby Cooperman Family Foundation (the “Foundation”), of which Mr. Leon Cooperman, a stockholder of the Company, is the trustee. The warrants were issued on November 5, 2018 (the “2018 Cooperman Warrants”) and on March 5, 2020 (the “2019 Cooperman Warrants”). The 2018 Cooperman Warrants exercise price was reduced from $5.85 to $5.56 per share. The 2019 Cooperman Warrants exercise price was reduced from $6.00 to $5.70 per share. On June 8, 2020, the Foundation immediately exercised the 2018 and 2019 Cooperman Warrants paying the Company $1,081,792 and the Company issued 192,049 shares of common stock to the Foundation.
COVID-19 Update
In our third fiscal quarter ending January 31, 2021, which has been historically a seasonally slower quarter given it falls during the holiday months of November and December, Aspen University saw approximately 4% less course registrations than seasonally expected in our Aspen Nursing + Other unit (which equates to approximately $110,000 of reduced revenue per month or $330,000 in the quarter relative to the Company’s forecast).
USU’s MSN-FNP program also saw a similar course start decline of approximately 4% in the quarter relative to the Company’s forecast, which equates to approximately $190,000 of reduced revenue for the quarter.
We believe COVID-19 ‘Wave Two’ was the key factor in the lower course starts than forecasted at both universities in the quarter, given that all the states in the country are now affected – not just some of the major metros. Our predominant student demographic of Registered Nurses (as of January 31, 2021, 9,277 of the Company’s 13,407 total active students or 69% are RNs) has been especially overwhelmed over the past several months, so this is not unexpected.
The status and/or reasons identified by our predominantly RN student body who constitute the lower course starts over the past several months fall into four categories; 1) rescheduling of upcoming course registrations to a later date, 2) requests for temporary leave of absence, 3) requests to delay placement into preferred clinical location timed with the facility accepting new in-person students again, and 4) course or program withdrawal requests due to family emergencies, pressures at work/emotional distress and lack of time.
The Company expects the COVID ‘Wave Two’ effect to continue throughout the current fourth fiscal quarter, as we are forecasting approximately 4.5% less course registrations than seasonally expected in our Aspen Nursing + Other unit and USU’s MSN-FNP program. Consequently, in our current fourth fiscal quarter ending April 30, 2021, we are expecting year-over-year revenue growth in the range of 31% - 33% ($18.4 - $18.7 million), versus the Company’s previous forecast of 36% growth or $19.1 million.
Results of Operations
Set forth below is the discussion of the results of operations of the Company for the three months ended January 31, 2021 (“Q3 Fiscal 2021”) compared to the three months ended January 31, 2020 (“Q3 Fiscal 2020”), and for the nine months ended January 31, 2021 (“9M Fiscal Q3 2021”) compared to the nine months ended January 31, 2020 (“9M Fiscal Q3 2020”).
Revenue
| | | | | | | | | | | | | | | | | | | | | | | | | | | | | | | | | | | | | | | | | | | | | | | |
| Three Months Ended January 31, | | Nine Months Ended January 31, |
| 2021 | | $ Change | | % Change | | 2020 | | 2021 | | $ Change | | % Change | | 2020 |
| Revenue | $ | 16,624,837 | | | $ | 4,086,897 | | | 33% | | $ | 12,537,940 | | | $ | 48,761,444 | | | $ | 13,779,557 | | | 39% | | $ | 34,981,887 | |
Q3 Fiscal 2021 compared to Q3 Fiscal 2020
Revenue from operations for Q3 Fiscal 2021 increased to $16,624,837 from $12,537,940 for Q3 Fiscal 2020, an increase of $4,086,897 or 33%. The increase was primarily due to enrollment and student body growth in USU’s MSN-FNP and Aspen’s BSN Pre-Licensure program, the degree programs with the highest lifetime value (LTV), partially offset by the reduction in revenue as the result of a course start decline resulting from the impact of the COVID-19 pandemic. The Company expects revenue growth to continue in future periods as we continue prioritizing our highest LTV degree programs to achieve our long-term growth plans.
Aspen University’s revenues in Q3 Fiscal 2021 increased 30% year-over-year, while USU's revenues in Q3 Fiscal 2021 increased 39% year-over-year.
Aspen University's traditional post-licensure online nursing + other business unit and doctoral unit contributed 49% of total Company revenue in Q3 Fiscal 2021, while Aspen University’s Pre-Licensure BSN program delivered 22% of the Company’s revenues in Q3 Fiscal 2021. Finally, USU contributed 29% of the total revenues for Q3 Fiscal 2021.
9M Fiscal Q3 2021 compared to 9M Fiscal Q3 2020
Revenue from operations for 9M Fiscal Q3 2021 increased to $48,761,444 from $34,981,887 for 9M Fiscal Q3 2020, an increase of $13,779,557 or 39%. The increase was primarily due to enrollment and student body growth in the degree programs with the highest lifetime value (LTV), partially offset by the reduction in revenue as the result of a course start decline resulting from the impact of the COVID-19 pandemic. The Company expects revenue growth to continue in future periods as we continue prioritizing our highest LTV degree programs to achieve our long-term growth plans.
Aspen University’s revenues in 9M Fiscal Q3 2021 increased 35% year-over-year, while USU's revenues in 9M Fiscal Q3 2021 increased 52% year-over-year.
Aspen University's traditional post-licensure online nursing + other business unit and doctoral unit contributed 51% of total Company revenue in 9M Fiscal Q3 2021, while Aspen University’s Pre-Licensure BSN program delivered 20% of the Company’s revenues in 9M Fiscal Q3 2021. Finally, USU contributed 29% of the total revenues for 9M Fiscal Q3 2021.
The Company expects the COVID ‘Wave Two’ effect to continue throughout the current fourth fiscal quarter, as we are forecasting approximately 4.5% less course registrations than seasonally expected in our Aspen Nursing + Other unit and USU’s MSN-FNP program. In our current fourth fiscal quarter ending April 30, 2021, we are expecting year-over-year revenue growth in the range of 31% - 33% ($18.4 - $18.7 million), versus the Company’s previous forecast of 36% growth or $19.1 million. Consequently, the Company now expects fiscal year 2021 annual revenue in the range of $67.2 million - $67.5 million or 37% - 38% growth year-over-year.
Cost of revenue (exclusive of depreciation and amortization shown separately below)
| | | | | | | | | | | | | | | | | | | | | | | | | | | | | | | | | | | | | | | | | | | | | | | |
| Three Months Ended January 31, | | Nine Months Ended January 31, |
| 2021 | | $ Change | | % Change | | 2020 | | 2021 | | $ Change | | % Change | | 2020 |
Cost of Revenues (exclusive of depreciation and amortization shown separately below) | $ | 7,559,951 | | | $ | 2,396,944 | | | 46% | | $ | 5,163,007 | | | $ | 20,732,254 | | | $ | 7,028,133 | | | 51% | | $ | 13,704,121 | |
| As a percentage of revenue | 45% | | | | | | 41% | | 43% | | | | | | 39% |
Q3 Fiscal 2021 compared to Q3 Fiscal 2020
Instructional costs and services
Instructional costs and services for Q3 Fiscal 2021 increased to $3,915,095 or 24% of revenues from $2,623,252 or 21% of revenues for Q3 Fiscal 2020, an increase of $1,291,843 or 49%. The increase was primarily due to more class starts year-over-year and additional full-time faculty staffing in the USU MSN-FNP program and the pre-licensure BSN campuses in Phoenix, Austin and Tampa. For example, during the third quarter, nine full-time faculty members were hired to support the growth of the pre-licensure program in Phoenix including incremental staffing to prepare for double cohorts at the main campus in Phoenix for the core semester which started on February 2, 2021.
Aspen University instructional costs and services represented 22% of Aspen University revenues for Q3 Fiscal 2021, while USU instructional costs and services was 27% of USU revenues during Q3 Fiscal 2021.
Marketing and promotional
Marketing and promotional costs for Q3 Fiscal 2021 were $3,644,856 or 22% of revenues compared to $2,536,755 or 20% of revenues for Q3 Fiscal 2020, an increase of $1,105,101 or 44%. The increase of marketing as a percentage of revenues from 20% to 22% year-over-year in Fiscal Q3 2021 is a result of a planned advertising spending increase throughout Fiscal Year
2021, targeted primarily to our highest LTV programs. In addition, the third quarter was the first full quarter of pre-revenue marketing spend in our two new pre-licensure metros, Austin and Tampa.
Aspen University marketing and promotional costs represented 20% of Aspen University revenues for Q3 Fiscal 2021, while USU marketing and promotional costs was 21% of USU revenues for Q3 Fiscal 2021.
AGI corporate marketing expenses was $250,474 for Q3 Fiscal 2021 compared to $252,602 for Q3 Fiscal 2020, an immaterial decrease of less than 1%.
9M Fiscal Q3 2021 compared to 9M Fiscal Q3 2020
Instructional costs and services
Instructional costs and services for 9M Fiscal Q3 2021 increased to $10,698,056 or 22% of revenues from $6,948,138 or 20% of revenues for 9M Fiscal Q3 2020, an increase of $3,749,918 or 54%. The increase was primarily due to more class starts year-over-year and additional full-time faculty staffing in the USU MSN-FNP program and the pre-licensure BSN campuses in Phoenix, Austin and Tampa.
Aspen University instructional costs and services represented 21% of Aspen University revenues for 9M Fiscal Q3 2021, while USU instructional costs and services was 25% of USU revenues during 9M Fiscal Q3 2021.
Marketing and promotional
Marketing and promotional costs for 9M Fiscal Q3 2021 were $10,034,198 or 21% of revenues compared to $6,755,983 or 19% of revenues for 9M Fiscal Q3 2020, an increase of $3,278,215 or 49%. The increase of marketing as a percentage of revenues from 19% to 21% year-over-year in 9M Fiscal Q3 2021 is a result of a planned advertising spending increase throughout Fiscal Year 2021, targeted primarily to our highest LTV programs, which has resulted in record new student enrollments during 1H Fiscal 2021. In addition, pre-revenue marketing spend commenced in the second quarter in our two new pre-licensure metros, Austin and Tampa.
Aspen University marketing and promotional costs represented 20% of Aspen University revenues for 9M Fiscal Q3 2021, while USU marketing and promotional costs was 18% of USU revenues for 9M Fiscal Q3 2021.
AGI corporate marketing expenses were $757,877 for 9M Fiscal Q3 2021 compared to $728,737 for 9M Fiscal Q3 2020, an increase of $29,139 or 4%.
General and administrative
| | | | | | | | | | | | | | | | | | | | | | | | | | | | | | | | | | | | | | | | | | | | | | | |
| Three Months Ended January 31, | | Nine Months Ended January 31, |
| 2021 | | $ Change | | % Change | | 2020 | | 2021 | | $ Change | | % Change | | 2020 |
General and administrative | $ | 10,644,438 | | | $ | 2,019,397 | | | 23% | | $ | 8,625,041 | | | $ | 30,723,349 | | | $ | 8,110,107 | | | 36% | | $ | 22,613,242 | |
| As a percentage of revenue | 64% | | | | | | 69% | | 63% | | | | | | 65% |
Q3 Fiscal 2021 compared to Q3 Fiscal 2020
General and administrative costs for Q3 Fiscal 2021 were $10,644,438 or 64% of revenues compared to $8,625,041 or 69% of revenues during Q3 Fiscal 2020, an increase of $2,019,397 or 23%. The increase was primarily due to higher headcount and related increase in compensation and benefits expense to support the growth of the business, new campus expansion costs of approximately $0.4 million at Aspen University, merchant banking fees and insurance expense. In connection with the resignation of the former Chief Financial Officer on February 25, 2021, the Company expects to incur nonrecurring accelerated stock-based compensation expense of approximately $0.6 million related to the automatic vesting of RSUs and options during the fourth quarter of 2021.
Aspen University general and administrative costs which are included in the above amount represented 36% of Aspen University revenues for Q3 Fiscal 2021. The increase was due, in part, to new campus expansion costs of approximately $0.4 million for investment in faculty and campus leadership positions to launch and support the new Tampa and Austin markets.
USU general and administrative costs equaled 44% of USU revenues for Q2 Fiscal 2021. The increase was primarily due to higher headcount and related increase in compensation and benefits expense to support the growth of the business.
AGI’s general and administrative costs for Q3 Fiscal 2021 and Q3 Fiscal 2020 which are included in the above amounts equaled $4.2 million and $2.8 million, respectively. The increase was primarily due to higher headcount and related increase in compensation and benefits expense to support the growth of the business, and increases in banking fees and insurance expense.
9M Fiscal Q3 2021 compared to 9M Fiscal Q3 2020
General and administrative costs for 9M Fiscal Q3 2021 was $30,723,349 or 63% of revenues compared to $22,613,242 or 65% of revenues for 9M Fiscal Q3 2020, an increase of $8,110,107 or 36%. The increase was primarily due to higher headcount and related increase in compensation and benefits expense to support the growth of the business and other-employee related costs, accelerated stock-based compensation amortization expense related to the $9 and $10 tranche RSU price vesting of $1.2 million at AGI in Q2 Fiscal 2021, new campus expansion costs of approximately $0.6 million at Aspen University; and increases in merchant banking fees and insurance expense. In connection with the resignation of the former Chief Financial Officer on February 25, 2021, the Company expects to incur nonrecurring accelerated stock-based compensation expense of approximately $0.6 million related to the automatic vesting of RSUs and options during the fourth quarter of 2021.
The remaining $12 tranche related to the Executive RSU grant has approximately $1.7 million of total unrecognized compensation expense at January 31, 2021, which is being amortized over the remaining period through February 4, 2024 when all RSUs will vest subject to continued employment, that could accelerate during the next two years. If our common stock meets the $12 price target, all remaining amortization will accelerate. Of the remaining approximately $1.7 million of total unrecognized compensation expense related to the $12 tranche of the executive RSU grant discussed above, the expense portion related to the Company's former Chief Financial Officer was approximately $0.3 million, which will be forfeited in February 2021.
Aspen University general and administrative costs which are included in the above amount represented 34% of Aspen University revenues for 9M Fiscal Q3 2021. The increase was primarily due to new campus expansion costs of approximately $0.6 million for investment in faculty and campus leadership positions to launch and support the new Tampa and Austin markets.
USU general and administrative costs equaled 42% of USU revenues for 9M Fiscal Q3 2021. The increase was primarily due to higher headcount and related increase in compensation and benefits expense to support the growth of the business.
AGI corporate general and administrative costs for 9M Fiscal Q3 2021 and 9M Fiscal Q3 2020 which are included in the above amounts was $13.1 million and $6.7 million, respectively. The increase was primarily due to higher headcount and related increase in compensation and benefits expense to support the growth of the business, non-cash accelerated stock-based compensation amortization expense related to the $9 and $10 tranche RSU price vesting of $1.2 million, and increases in banking fees and insurance expense.
Bad debt expense
| | | | | | | | | | | | | | | | | | | | | | | | | | | | | | | | | | | | | | | | | | | | | | | |
| Three Months Ended January 31, | | Nine Months Ended January 31, |
| 2021 | | $ Change | | % Change | | 2020 | | 2021 | | $ Change | | % Change | | 2020 |
Bad debt expense | $670,000 | | $ | 667,453 | | | 26,205% | | $2,547 | | $ | 1,702,000 | | | $ | 1,050,795 | | | 161% | | $ | 651,205 | |
| As a percentage of revenue | 4% | | | | | | —% | | 3% | | | | | | 2% |
Q3 Fiscal 2021 compared to Q3 Fiscal 2020
Bad debt expense for Q3 Fiscal 2021 increased to $670,000 from $2,547 for Q3 Fiscal 2020, an increase of $667,453. Based on revenue growth trends and review of accounts receivable, the Company evaluated its reserve methodology and increased reserves for Aspen and USU accordingly, as well as $270,000 of Aspen University student accounts were written off.
9M Fiscal Q3 2021 compared to 9M Fiscal Q3 2020
Bad debt expense for 9M Fiscal Q3 2021 increased to $1,702,000 from $651,205 for 9M Fiscal Q3 2020, an increase of $1,050,795, or 161%. Based on revenue growth trends and review of accounts receivable, the Company evaluated its reserve
methodology and increased reserves for Aspen and USU accordingly, as well as approximately $500,000 of Aspen University student accounts were written off in 9M Fiscal Q3 2021.
Depreciation and amortization
| | | | | | | | | | | | | | | | | | | | | | | | | | | | | | | | | | | | | | | | | | | | | | | |
| Three Months Ended January 31, | | Nine Months Ended January 31, |
| 2021 | | $ Change | | % Change | | 2020 | | 2021 | | $ Change | | % Change | | 2020 |
Depreciation and amortization | $535,273 | | $ | 59,880 | | | 13% | | $475,393 | | $ | 1,552,254 | | | $ | (157,938) | | | (9)% | | $ | 1,710,192 | |
| As a percentage of revenue | 3% | | | | | | 4% | | 3% | | | | | | 5% |
Q3 Fiscal 2021 compared to Q3 Fiscal 2020
Depreciation and amortization for Q3 Fiscal 2021 increased to $535,273 from $475,393 for Q3 Fiscal 2020, an increase of $59,880, or 13%. The increase in depreciation and amortization expense is due primarily to investments in developed capitalized software to support the Company's services and computer equipment.
9M Fiscal Q3 2021 compared to 9M Fiscal Q3 2020
Depreciation and amortization for 9M Fiscal Q3 2021 decreased to $1,552,254 from $1,710,192 for 9M Fiscal Q3 2020, a decrease of $157,938, or 9%. The decrease in depreciation and amortization expense is due primarily to intangible assets becoming fully amortized at USU, partially offset by investments in developed capitalized software to support the Company's services and computer equipment.
Other expense, net
| | | | | | | | | | | | | | | | | | | | | | | | | | | | | | | | | | | | | | | | | | | | | | | |
| Three Months Ended January 31, | | Nine Months Ended January 31, |
| 2021 | | $ Change | | % Change | | 2020 | | 2021 | | $ Change | | % Change | | 2020 |
Other expense, net | $19,981 | | $ | (517,860) | | | (96)% | | $537,841 | | $2,135,484 | | $ | 900,363 | | | 73% | | $1,235,121 |
Q3 Fiscal 2021 compared to Q3 Fiscal 2020
Other expense, net in Q3 Fiscal 2021 of $19,981 primarily includes interest expense related to the commitment fees on the undrawn $5 million Revolving Credit Facility which matures on November 4, 2021; with a 2% commitment fee on the undrawn portion payable quarterly. With the conversion of the $10 million Convertible Notes on September 14, 2020, the Company does not intend to borrow under this Facility.
Other expense, net in Q3 Fiscal 2020 of $537,841 includes: interest expense of $571,958 primarily related to (i) the $10 million Senior Secured Term Loans issued on March 6, 2019, with an annual interest rate of 12% payable monthly, (which were cancelled and exchanged for the $10 million Convertible Notes on January 22, 2020) and the write-off of the debt discount in connection with a debt extinguishment related to issued $10 million Convertible Debt on January 22, 2020 (the write-off was approximately $200,000 and included in one-time expense items); and (ii) the commitment fees on the $5 million Revolving Credit Facility; partially offset by $34,117 of other income.
9M Fiscal Q3 2021 compared to 9M Fiscal Q3 2020
Other expense, net in 9M Fiscal Q3 2021 of $2,135,484 primarily includes: interest expense of (i) a non-cash charge of $1.4 million of accelerated amortization expense related to the conversion of the $10 million Convertible Notes which occurred on September 14, 2020; (ii) $0.5 million for the $10 million Convertible Notes issued on January 22, 2020 as well as the commitment fee on the $5 million Revolving Credit Facility; (iii) an adjustment of $0.3 million related to the previously reported earned revenue fee calculation deemed immaterial to our Fiscal 2019 revenue; (iv) a non-cash modification and accelerated amortization charges of $0.2 million related to the exercise of the 2018 and 2019 Cooperman Warrants on June 5, 2020; partially offset by $0.3 million of other income.
Other expense, net in 9M Fiscal Q3 2020 of $1,235,121 includes: interest expense of $1.4 million primarily related to (i) the $10 million Senior Secured Term Loans issued on March 6, 2019 and the write-off of debt discount in connection with a debt extinguishment related to issued $10 million Convertible Debt on January 22, 2020 (the write-off was approximately $200,000
and included in one-time expense items); and (ii) the commitment fees on the $5 million Revolving Credit Facility; partially offset by $0.2 million of other income.
Net loss
| | | | | | | | | | | | | | | | | | | | | | | | | | | | | | | | | | | | | | | | | | | | | | | |
| Three Months Ended January 31, | | Nine Months Ended January 31, |
| 2021 | | $ Change | | % Change | | 2020 | | 2021 | | $ Change | | % Change | | 2020 |
Net loss | $(2,815,266) | | $ | (534,214) | | | (23)% | | $(2,281,052) | | $ | (8,128,987) | | | $ | (3,134,485) | | | (63)% | | $ | (4,994,502) | |
Q3 Fiscal 2021 compared to Q3 Fiscal 2020
Net loss was $(2,815,266), or net loss per basic and diluted share of $(0.11) for Q3 Fiscal 2021 as compared to $(2,281,052), or net loss per share of $(0.12) for Q3 Fiscal 2020, or an increase in net loss of $(534,214), or (23)%.
9M Fiscal Q3 2021 compared to 9M Fiscal Q3 2020
Net loss was $(8,128,987), or net loss per basic and diluted share of $(0.35) for 9M Fiscal Q3 2021 as compared to $(4,994,502), or net loss per share of $(0.26) for 9M Fiscal Q3 2020, or an increase in net loss of $(3,134,485), or (63)%.
This increase in net loss of $3.1 million includes $2.6 million of non-cash items previously disclosed ($1.2 million non-cash charge related to the RSU vesting, and the $1.4 million charge related to the conversion of $10 million Convertible Notes). Without these two items, the net loss increase would have been approximately $0.5 million. This $0.5 million increase in net loss year-over-year is primarily a result of the new campus costs (approximately $0.4 million) disclosed above.
Non-GAAP Financial Measures
This discussion and analysis includes both financial measures in accordance with Generally Accepted Accounting Principles, or GAAP, as well as non-GAAP financial measures. Generally, a non-GAAP financial measure is a numerical measure of a company’s performance, financial position or cash flows that either excludes or includes amounts that are not normally included or excluded in the most directly comparable measure calculated and presented in accordance with GAAP. Non-GAAP financial measures should be viewed as supplemental to, and should not be considered as alternatives to net income (loss), operating income (loss), and cash flow from operating activities, liquidity or any other financial measures. They may not be indicative of the historical operating results of AGI nor are they intended to be predictive of potential future results. Investors should not consider non-GAAP financial measures in isolation or as substitutes for performance measures calculated in accordance with GAAP.
Our management uses and relies on Adjusted Net Income (Loss), Adjusted Earnings (Loss) Per Share, EBITDA, Adjusted EBITDA and Adjusted Gross Profit, which are non-GAAP financial measures. We believe that management, analysts and shareholders benefit from referring to the following non-GAAP financial measures to evaluate and assess our core operating results from period-to-period after removing the impact of items that affect comparability. Our management recognizes that the non-GAAP financial measures have inherent limitations because of the excluded items described below.
We have included a reconciliation of our non-GAAP financial measures to the most comparable financial measures calculated in accordance with GAAP. We believe that providing the non-GAAP financial measures, together with the reconciliation to GAAP, helps investors make comparisons between AGI and other companies. In making any comparisons to other companies, investors need to be aware that companies use different non-GAAP measures to evaluate their financial performance. Investors should pay close attention to the specific definition being used and to the reconciliation between such measure and the corresponding GAAP measure provided by each company under applicable SEC rules.
Adjusted Net Income (Loss) and Adjusted Earnings (Loss) Per Share
AGI defines Adjusted Net Income (Loss) as net earnings (loss) from operations adding back stock-based compensation expense and non-recurring charges as reflected in the table below.
9M Fiscal Q3 2021 primarily includes non-cash stock-based compensation expense of $1.2 million related to the accelerated amortization expense for the price vesting of Executive RSUs and non-recurring charges includes a $1.4 million interest expense charge related to the conversion of $10 million Convertible Notes and $0.1 million of interest expense which arose from the acceleration of amortization arising from the exercise of warrants issued to a lender.
The following table presents a reconciliation of net loss and earnings (loss) per share to Adjusted Net Income (Loss) and Adjusted Earnings (Loss) Per Share:
| | | | | | | | | | | | | | | | | | | | | | | |
| Three Months Ended January 31, | | Nine Months Ended January 31, |
| 2021 | | 2020 | | 2021 | | 2020 |
| Earnings (loss) per share | $ | (0.11) | | | $ | (0.12) | | | $ | (0.35) | | | $ | (0.26) | |
| Weighted average number of common stock outstanding* | 24,544,334 | | | 19,420,987 | | | 23,354,036 | | | 19,046,558 | |
| Net loss | $ | (2,815,266) | | | $ | (2,281,052) | | | $ | (8,128,987) | | | $ | (4,994,502) | |
| Add back: | | | | | | | |
| Stock-based compensation | 701,170 | | | 347,210 | | | 3,019,828 | | | 1,341,245 | |
| Non-recurring charges | — | | | 1,010,123 | | | 1,906,203 | | | 1,143,072 | |
| Adjusted Net (Loss) | $ | (2,114,096) | | | $ | (923,719) | | | $ | (3,202,956) | | | $ | (2,510,185) | |
| | | | | | | |
| Adjusted (Loss) per Share | $ | (0.09) | | | $ | (0.05) | | | $ | (0.14) | | | $ | (0.13) | |
________________
*Same share count used for GAAP and non-GAAP financial measures.
EBITDA and Adjusted EBITDA
AGI defines Adjusted EBITDA as EBITDA excluding: (1) bad debt expense; (2) stock-based compensation; and (3) non-recurring charges. The following table presents a reconciliation of net loss to EBITDA and Adjusted EBITDA:
| | | | | | | | | | | | | | | | | | | | | | | |
| Three Months Ended January 31, | | Nine Months Ended January 31, |
| 2021 | | 2020 | | 2021 | | 2020 |
| Net loss | $ | (2,815,266) | | | $ | (2,281,052) | | | $ | (8,128,987) | | | $ | (4,994,502) | |
| Interest expense, net | 33,436 | | | 570,020 | | | 2,018,176 | | | 1,416,784 | |
| Taxes | 10,460 | | | 98,173 | | | 45,090 | | | 243,035 | |
| Depreciation and amortization | 535,273 | | | 475,393 | | | 1,552,254 | | | 1,710,192 | |
| EBITDA | (2,236,097) | | | (1,137,466) | | | (4,513,467) | | | (1,624,491) | |
| Bad debt expense | 670,000 | | | 2,547 | | | 1,702,000 | | | 651,205 | |
| Stock-based compensation | 701,170 | | | 347,210 | | | 3,019,828 | | | 1,341,245 | |
| Non-recurring charges | — | | | 1,010,123 | | | 419,437 | | | 1,143,072 | |
| Adjusted EBITDA | $ | (864,927) | | | $ | 222,414 | | | $ | 627,798 | | | $ | 1,511,031 | |
Q3 Fiscal 2021 compared to Q3 Fiscal 2020
The Company had a net loss $(2,815,266) for Q3 Fiscal 2021 compared to a net loss of $(2,281,052) for Q3 Fiscal 2020, EBITDA loss of $(2,236,097) for Q3 Fiscal 2021 compared to an EBITDA loss of $(1,137,466) for Q3 Fiscal 2020 and Adjusted EBITDA decreased to $(0.9) million for Q3 Fiscal 2021 from Adjusted EBITDA of $0.2 million for Q3 Fiscal 2020.
Aspen University generated $1.4 million of net income, EBITDA of $1.9 million and Adjusted EBITDA of $2.5 million in Q3 Fiscal 2021 as compared to $1.3 million of net income, EBITDA of $1.6 million and Adjusted EBITDA of $1.9 million in Q3 Fiscal 2020.
Aspen’s Pre-Licensure BSN program generated an EBITDA margin of 28%, as the unit delivered $1.0 million of the $1.9 million EBITDA generated at Aspen University in Q3 Fiscal 2021, as compared to $0.6 million of the $1.6 million EBITDA generated in Q3 Fiscal 2020. Aspen’s Pre-Licensure BSN program in the Phoenix metro generated EBITDA of $1.8 million or a margin of 52%, offset by the two new campuses incurring an EBITDA loss of ($0.8) million for Q3 Fiscal 2021.
USU generated net income of $0.3 million, EBITDA of $0.4 million and Adjusted EBITDA of $0.5 million in Q3 Fiscal 2021 as compared to net income of less than $0.1 million, EBITDA of $0.2 million and Adjusted EBITDA of $0.2 million in Q3 Fiscal 2020.
AGI corporate incurred a net loss of $(4.5 million), EBITDA of ($4.5 million) and Adjusted EBITDA of ($3.8 million) in Q3 Fiscal 2021 as compared to a net loss of $(3.6 million), EBITDA of ($3.0 million) and Adjusted EBITDA of ($1.9 million) in Q3 Fiscal 2020.
9M Fiscal Q3 2021 compared to 9M Fiscal Q3 2020
The Company had a net loss of $(8,128,987) for 9M Fiscal Q3 2021 compared to a net loss of $(4,994,502) for 9M Fiscal 2020, EBITDA loss of $(4,513,467) for 9M Fiscal Q3 2021 compared to an EBITDA loss of $(1,624,491) for 9M Fiscal Q3 2020 and Adjusted EBITDA decreased to $627,798 for 9M Fiscal Q3 2021 from Adjusted EBITDA of $1,511,031 for 9M Fiscal Q3 2020.
Aspen University generated $5.9 million of net income, EBITDA of $7.3 million and Adjusted EBITDA of $9.0 million in 9M Fiscal Q3 2021 as compared to $4.0 million of net income, EBITDA of $5.0 million and Adjusted EBITDA of $6.0 million in 9M Fiscal Q3 2020. Aspen’s Pre-Licensure BSN program accounted for $3.1 million of the $7.3 million EBITDA generated at Aspen University in 9M Fiscal Q3 2021 as compared to $1.5 million of the $5.0 million EBITDA generated in 9M Fiscal Q3 2020.
USU generated net income of $1.9 million, EBITDA of $2.0 million and Adjusted EBITDA of $2.3 million in 9M Fiscal Q3 2021 as compared to net loss of $(0.2) million, EBITDA of $0.5 million and Adjusted EBITDA of $0.8 million in 9M Fiscal Q3 2020.
AGI corporate incurred a net loss of $(15.9 million), EBITDA of ($13.9 million) and Adjusted EBITDA of ($10.6 million) in 9M Fiscal Q3 2021 as compared to a net loss of $(8.8 million), EBITDA of ($7.1 million) and Adjusted EBITDA of ($7.0 million) in 9M Fiscal Q3 2020. Adjusted EBITDA in 9M Fiscal Q3 2021 includes non-cash stock based compensation expense of $1.2 million related to the accelerated amortization expense for the price vesting of Executive RSUs in Q2 Fiscal 2021 and $419,437 of non-recurring charges in Q1 Fiscal 2021. EBITDA in Q2 Fiscal 2021 includes $1.4 million related to the accelerated amortization expense of the original issue discount for the automatic conversion of $10 million Convertible Notes on September 14, 2020. An additional non-recurring item in Q1 Fiscal 2021 of $123,947 is included in interest expense, net, which arose from the acceleration of amortization arising from the exercise of warrants issued to a lender. Adjusted EBITDA in 9M Fiscal Q3 2020 includes one-time expense items primarily related to the January 2020 equity financing and the CFO transition.
The following table presents a reconciliation of net loss to EBITDA and Adjusted EBITDA by business unit:
| | | | | | | | | | | | | | | | | | | | | | | | | | | | | | | | | | | |
| Three Months Ended January 31, 2021 |
| Consolidated | | AGI Corporate | | Aspen BSN Pre-Licensure | | AU Online | | AU Total | | USU |
| Net income (loss) | $ | (2,815,266) | | | $ | (4,537,882) | | | $ | 989,100 | | 1 | $ | 386,259 | | | $ | 1,375,359 | | | $ | 347,257 | |
| Interest expense, net | 33,436 | | | 33,516 | | | — | | | — | | | — | | | (80) | |
| Taxes | 10,460 | | | 3,600 | | | — | | | 6,800 | | | 6,800 | | | 60 | |
| Depreciation and amortization | 535,273 | | | 15,540 | | | 25,000 | | | 467,303 | | | 492,303 | | | 27,430 | |
| EBITDA | (2,236,097) | | | (4,485,226) | | | 1,014,100 | | 1 | 860,362 | | | 1,874,462 | | | 374,667 | |
| Bad debt expense | 670,000 | | | — | | | — | | | 610,000 | | | 610,000 | | | 60,000 | |
| Stock-based compensation | 701,170 | | | 692,244 | | | — | | | (12,468) | | | (12,468) | | | 21,394 | |
| Adjusted EBITDA | $ | (864,927) | | | $ | (3,792,982) | | | $ | 1,014,100 | | 1 | $ | 1,457,894 | | | $ | 2,471,994 | | | $ | 456,061 | |
1Aspen’s BSN Pre-Licensure program accounted for net income of $1.0 million (which includes $1.8 million of net income from the Phoenix metro, offset by the net loss of ($0.8) million in the Austin and Tampa metros) of the $1.4 million generated at Aspen University. Aspen’s BSN Pre-Licensure program accounted for EBITDA of $1.0 million of the $1.9 million EBITDA generated at Aspen University, operating at an EBITDA margin of 28% - the highest margin unit of the Company. Reconciliation from net income to EBITDA and Adjusted EBITDA for the Aspen BSN Pre-Licensure program delivers the same result, as there were no material interest, taxes, depreciation and amortization expenses incurred in this unit.
Adjusted Gross Profit
AGI defines Adjusted Gross Profit as GAAP Gross Profit including amortization expense which is included in cost of revenue on the statements of operations. The following table presents a reconciliation of GAAP Gross Profit to Adjusted Gross Profit inclusive of amortization:
| | | | | | | | | | | | | | | | | | | | | | | |
| Three Months Ended January 31, | | Nine Months Ended January 31, |
| 2021 | | 2020 | | 2021 | | 2020 |
| GAAP Gross Profit | $8,691,601 | | $7,094,150 | | $26,971,682 | | $20,497,674 |
| Add back amortization expense included in cost of revenue: | | | | | | | |
| Intangible asset amortization | 10,255 | | 15,637 | | 32,718 | | 51,696 |
| Call center software/website amortization | 363,030 | | 265,146 | | 1,024,790 | | 728,396 |
| Total amortization included in cost of revenue | 373,285 | | 280,783 | | 1,057,508 | | 780,092 |
| Adjusted Gross Profit | $9,064,886 | | $7,374,933 | | $28,029,190 | | $21,277,766 |
| | | | | | | |
| Revenue | $16,624,837 | | $12,537,940 | | $48,761,444 | | $34,981,887 |
| Cost of Revenue | 7,559,951 | | 5,163,007 | | 20,732,254 | | 13,704,121 |
| Adjusted Gross Profit | $9,064,886 | | $7,374,933 | | $28,029,190 | | $21,277,766 |
| | | | | | | |
| GAAP Gross Profit as a % of revenue | 52 | % | | 57 | % | | 55 | % | | 59 | % |
| Adjusted Gross Profit as a % of revenue | 55 | % | | 59 | % | | 57 | % | | 61 | % |
Q3 Fiscal 2021 compared to Q3 Fiscal 2020
GAAP Gross profit increased by 23% to $8,691,601 or 52% gross margin for Q3 Fiscal 2021 from $7,094,150 or 57% gross margin in Q3 Fiscal 2020. Adjusted Gross profit increased 23% to $9,064,886 or 55% gross margin for Q3 Fiscal 2021 from $7,374,933 or 59% gross margin in Q3 Fiscal 2020.
Aspen University GAAP Gross Profit represented 54% of Aspen University revenues for Q3 Fiscal 2021, and USU GAAP Gross Profit represented 53% of USU revenues for Q3 Fiscal 2021.
Aspen University GAAP Gross Profit includes the impact of increased spend in our two new pre-licensure metros, Austin and Tampa, and incremental staffing expense to prepare for double cohorts at the main campus in Phoenix for the core semester which started on February 2, 2021.
9M Fiscal Q3 2021 compared to 9M Fiscal Q3 2020
GAAP Gross Profit increased by 32% to $26,971,682 or 55% gross margin for 9M Fiscal Q3 2021 from $20,497,674 or 59% gross margin in 9M Fiscal Q3 2020. Adjusted Gross profit increased 32% to $28,029,190 or 57% gross margin for 9M Fiscal Q3 2021 from $21,277,766 or 61% gross margin in 9M Fiscal Q3 2020.
Aspen University GAAP Gross Profit represented 57% of Aspen University revenues for 9M Fiscal Q3 2021, and USU GAAP Gross Profit represented 58% of USU revenues for 9M Fiscal Q3 2021.
Liquidity and Capital Resources
A summary of the Company's cash flows is as follows:
| | | | | | | | | | | |
| Nine Months Ended
January 31, |
| 2021 | | 2020 |
| Net cash (used in) provided by | | | |
| Operating activities | $ | (5,275,719) | | | $ | (3,825,265) | |
| Investing activities | (2,909,088) | | | (1,940,879) | |
| Financing activities | 3,660,492 | | | 16,767,411 | |
| Net decrease in cash | $ | (4,524,315) | | | $ | 11,001,267 | |
Net Cash Used in Operating Activities
Net cash used in operating activities for the nine months ended January 31, 2021 consists of net loss adjusted for non-cash items and the effect of changes in working capital. Non-cash adjustments include stock-based compensation, bad debt expense, depreciation and amortization expense, amortization of debt discounts and issue costs, warrants issued for services, modification charge for warrants exercised, common shares issued for services and other adjustments.
Adjustments to net loss consist primarily of stock-based compensation of $3,019,828, bad debt expense of $1,702,000, amortization of debt discounts of $1,550,854, and depreciation and amortization expense of $1,552,254. The increase from changes in working capital primarily consists of increases in gross accounts receivable (both short and long term accounts receivable, before allowance for doubtful accounts) of $6,493,238 and other current assets of $1,205,083, partially offset by an increase in deferred revenue of $1,887,377 and accrued expenses of $1,756,102. The increase in accounts receivable is primarily attributed to the growth in revenues from increased enrollments and students paying through the monthly payment plan as well as timing of billings for class starts. Other current assets increased primarily due to reimbursable tenant improvement costs of $1.3 million paid in Fiscal 2021 related to the build out of the Tampa and Austin campuses. The increase in deferred revenue is due primarily to timing of billings for class starts. The increase in accrued expenses is due primarily to accrual of executive bonus for Fiscal 2021, accrued payroll due to higher headcount and related increase in compensation and benefits expense to support the growth of the business and an increase in accrued marketing due to timing.
The Company expects a favorable trend in working capital over time, but there may be volatility from quarter to quarter. In aggregate the Company expects a general trend toward lower cash used in operations in future quarters; however, some quarters could have higher cash used in operations as a result of more cash used to support changes in working capital. Program start timings and the related federal financial aid drawdowns also impact cash timing.
Net cash used in operations for the nine months ended January 31, 2020 consist primarily of depreciation and amortization expense of $1,710,192, stock-based compensation of $1,782,472 and bad debt expense of $651,205. The increase from changes in working capital primarily consists of an increase in gross accounts receivable (both short and long term accounts receivable, before allowance for doubtful accounts) of $7,104,911, partially offset by increases in deferred revenue of $3,237,878 and $1,137,244 due to students. The increase in accounts receivable is primarily attributed to the growth in revenues from increased enrollments and students paying through the monthly payment plan as well as timing of billings for class starts. The increase in deferred revenue is due primarily to timing of billings for class starts.
Net Cash Used in Investing Activities
Net cash used in investing activities for the nine months ended January 31, 2021 includes purchases of property and equipment of $2,877,758 primarily due to investments in computer equipment and hardware, Company developed software and new campuses; and purchases of courseware and accreditation of $31,330.
Net cash used in investing activities for the nine months ended January 31, 2020 includes purchases of property and equipment of $1,929,878 primarily due to investments in Company developed software, computer equipment and hardware, instructional equipment and new campuses; and purchases of courseware and accreditation of $11,001.
Net Cash Provided By Financing Activities
Net cash provided by financing activities for the nine months ended January 31, 2021 includes proceeds from stock options exercised of $2,578,700 and proceeds from warrants exercised of $1,081,792 received from the cash exercise of warrants associated with the Term Loan and Revolving Credit Facility.
Net cash provided by financing activities for the nine months ended January 31, 2020 includes proceeds from the sale of common stock, net of underwriter costs of $16,044,879 and proceeds from stock options exercised of $768,381, partially offset by $51,282 of disbursements for equity offering costs.
Liquidity and Capital Resources
At March 11, 2021, the Company had cash deposits of approximately $13.4 million and approximately $4.0 million of restricted cash. Our cash balances are kept liquid to support our growing infrastructure needs. The majority of our cash is concentrated in large financial institutions.
The Company also has access to a $5 million Revolving Credit Facility. At January 31, 2021 and April 30, 2020, there were no outstanding borrowings under this credit facility. With the conversion of the Convertible Notes on September 14, 2020, the Company does not intend to borrow under this facility.
The Company anticipates that it will need to make capital and other expenditures in connection with the development and expansion of its campus operations. The Company's FY Fiscal 2021 capital expenditures are expected to be higher than FY Fiscal 2020 capital expenditures by approximately $1.0 million related to new campus costs. Additionally, the Company expects additional cash commitments for letters of credits related to securing new campus locations.
The Company expects that its existing cash resources will be sufficient to fund its working capital, including capital expenditures, investing and other needs for more than the next 12 months.
Critical Accounting Policies and Estimates
In response to financial reporting release FR-60, Cautionary Advice Regarding Disclosure About Critical Accounting Policies, from the SEC, we have selected our more subjective accounting estimation processes for purposes of explaining the methodology used in calculating the estimate, in addition to the inherent uncertainties pertaining to the estimate and the possible effects on our financial condition. There were no material changes to our principal accounting estimates during the period covered by this report.
Revenue Recognition and Deferred Revenue
Revenue consisting primarily of tuition and fees derived from courses taught by Aspen online as well as from related educational resources that Aspen provides to its students, such as access to our online materials and learning management system. Tuition revenue is recognized pro-rata over the applicable period of instruction. Aspen maintains an institutional tuition refund policy, which provides for all or a portion of tuition to be refunded if a student withdraws during stated refund periods. Certain states in which students reside impose separate, mandatory refund policies, which override Aspen’s policy to the extent in conflict. If a student withdraws at a time when a portion or none of the tuition is refundable, then in accordance with its revenue recognition policy, Aspen recognizes as revenue the tuition that was not refunded. Since Aspen recognizes revenue pro-rata over the term of the course and because, under its institutional refund policy, the amount subject to refund is never greater than the amount of the revenue that has been deferred, under Aspen’s accounting policies revenue is not recognized with respect to amounts that could potentially be refunded. Aspen’s educational programs have starting and ending dates that differ from its fiscal quarters. Therefore, at the end of each fiscal quarter, a portion of revenue from these programs is not yet earned and is therefore deferred. Aspen also charges students annual fees for library, technology and other services, which are recognized over the related service period.
Deferred revenue represents the amount of tuition, fees, and other student payments received in excess of the portion recognized as revenue and it is included in current liabilities in the accompanying consolidated balance sheets. Other revenue may be recognized as sales occur or services are performed.
Accounts Receivable and Allowance for Doubtful Accounts Receivable
All students are required to select both a primary and secondary payment option with respect to amounts due to Aspen for tuition, fees and other expenses. The most common payment option for Aspen’s students is personal funds or payment made on their behalf by an employer. In instances where a student selects financial aid as the primary payment option, he or she often selects personal cash as the secondary option. If a student who has selected financial aid as his or her primary payment option withdraws prior to the end of a course but after the date that Aspen’s institutional refund period has expired, the student will have incurred the obligation to pay the full cost of the course. If the withdrawal occurs before the date at which the student has earned 100% of his or her financial aid, Aspen will have to return all or a portion of the Title IV funds to the DOE and the student will owe Aspen all amounts incurred that are in excess of the amount of financial aid that the student earned and that Aspen is entitled to retain. In this case, Aspen must collect the receivable using the student’s second payment option.
For accounts receivable from students, Aspen records an allowance for doubtful accounts for estimated losses resulting from the inability, failure or refusal of its students to make required payments, which includes the recovery of financial aid funds advanced to a student for amounts in excess of the student’s cost of tuition and related fees. Aspen determines the adequacy of its allowance for doubtful accounts using a general reserve method based on an analysis of its historical bad debt experience, current economic trends, and the aging of the accounts receivable and student status. AGI establishes reserves to its receivables based upon an estimate of the risk presented by the program within the university, student status, payment type and age of receivables. Aspen writes off accounts receivable balances at the time the balances are deemed uncollectible. Aspen continues to reflect accounts receivable with an offsetting allowance as long as management believes there is a reasonable possibility of collection.
For accounts receivable from primary payors other than students, Aspen estimates its allowance for doubtful accounts by evaluating specific accounts where information indicates the customers may have an inability to meet financial obligations, such as bankruptcy proceedings and receivable amounts outstanding for an extended period beyond contractual terms. In these cases, Aspen uses assumptions and judgment, based on the best available facts and circumstances, to record a specific allowance for those customers against amounts due to reduce the receivable to the amount expected to be collected. These specific allowances are re-evaluated and adjusted as additional information is received. The amounts calculated are analyzed to determine the total amount of the allowance. Aspen may also record a general allowance as necessary.
Direct write-offs are taken in the period when Aspen has exhausted its efforts to collect overdue and unpaid receivables or otherwise evaluate other circumstances that indicate that Aspen should abandon such efforts.
Business Combinations
We include the results of operations of businesses we acquire from the date of the respective acquisition. We allocate the purchase price of acquisitions to the assets acquired and liabilities assumed at fair value. The excess of the purchase price of an acquired business over the amount assigned to the assets acquired and liabilities assumed is recorded as goodwill. We expense transaction costs associated with business combinations as incurred.
Goodwill and Intangibles
Goodwill represents the excess of purchase price over the fair market value of assets acquired and liabilities assumed from the 2017 acquisition of USU. Goodwill has an indefinite life and is not amortized. Goodwill is tested annually for impairment.
In January 2017, the Financial Accounting Standards Board issued Accounting Standards Update No. 2017-04: "Intangibles - Goodwill and Other (Topic 350)” - to simplify how an entity is required to test goodwill for impairment by eliminating Step 2 from the goodwill impairment test. Step 2 measures a goodwill impairment loss by comparing the implied fair value of a reporting unit’s goodwill with the carrying amount of that goodwill. This guidance is effective for interim and annual reporting periods beginning after December 15, 2019. The Company early adopted this standard effective April 30, 2018. We have selected an April 30 annual goodwill impairment test date.
When evaluating the potential impairment of goodwill, management first assess a range of qualitative factors, including but not limited to, macroeconomic conditions, industry conditions, the competitive environment, changes in the market for the Company’s products and services, regulatory and political developments, entity specific factors such as strategy and changes in key personnel, and the overall financial performance for each of the Company’s reporting units. If, after completing this assessment, it is determined that it is more likely than not that the fair value of a reporting unit is less than its carrying value, we then proceed to the quantitative impairment testing.
We compare the carrying value of the reporting unit, including goodwill, with its fair value, as determined. If the carrying value of a reporting unit exceeds its fair value, then the amount of impairment to be recognized is the amount by which the carrying amount exceeds the fair value.
When required, we arrive at our estimates of fair value using a discounted cash flow methodology which includes estimates of future cash flows to be generated by a component where the goodwill is recorded, as well as determining a discount rate to measure the present value of those anticipated cash flows. Estimating future cash flows requires significant judgment and includes making assumptions about projected growth rates, industry-specific factors, working capital requirements, weighted average cost of capital, and current and anticipated operating conditions. The use of different assumptions or estimates for future cash flows could produce different results.
Intangible assets represent both indefinite lived and definite lived assets. Accreditation and regulatory approvals and Trade name and trademarks are deemed to have indefinite useful lives and accordingly are not amortized but are tested annually for impairment. Student relationships and curriculums are deemed to have definite lives and are amortized accordingly.
Stock-based compensation
Stock-based compensation expense is measured at the grant date fair value of the award and is expensed over the requisite service period, which is included in general and administrative expense in the consolidated statement of operations. For employee stock-based awards, the Company calculates the fair value of the award on the date of grant using the Black-Scholes option pricing model. Determining the fair value of stock-based awards at the grant date under this model requires judgment, including estimating volatility, employee stock option exercise behaviors and forfeiture rates. The assumptions used in
calculating the fair value of stock-based awards represent the Company's best estimates, but these estimates involve inherent uncertainties and the application of management judgment. For non-employee stock-based awards, the Company follows ASU 2018-7, which substantially aligns share based compensation for employees and non-employees.
RSUs are awards in the form of shares denominated in the equivalent number of shares of ASPU common stock and with the value of each RSU being equal to the fair value of ASPU common stock at the date of grant. RSU awards may be subject to service-based vesting, where a specific period of continued employment must pass before an award vests and/or other vesting restrictions based on the nature and recipient of the award. For RSU awards, the expense is typically measured at the grant date as the fair value of ASPU common stock and expensed as stock-based compensation over the vesting term, which is included in general and administrative expense in the consolidated statement of operations.
Off Balance Sheet Arrangements
The Company does not have any off-balance sheet arrangements as of January 31, 2021.
Cautionary Note Regarding Forward Looking Statements
This report contains forward-looking statements within the meaning of the Private Securities Litigation Reform Act of 1995, including statements regarding the impact of COVID-19 on our fourth fiscal quarter revenues and the economic impact on us beyond that, the number of new nursing campuses and the timing of opening new locations, the timing of our planned USU MSN-FNP weekend lab immersion expansions, the expected effect of telehealth partnership with A-APN, including in relation to expected graduation dates, the future amortization of price based Restricted Stock Units and the timing of any possible acceleration, our estimates concerning Lifetime Value, MER, and ARPU, our fiscal 2021 revenues and revenue growth, our future early losses from, and capital expenditures related to, the opening of new campuses, our estimates as to our accounts receivable and allowance for doubtful accounts, including as a percentage of total revenue and our future liquidity. All statements other than statements of historical facts contained in this report, including statements regarding our future financial position, liquidity, business strategy and plans and objectives of management for future operations, are forward-looking statements. The words “believe,” “may,” “estimate,” “continue,” “anticipate,” “intend,” “should,” “plan,” “could,” “target,” “potential,” “is likely,” “will,” “expect” and similar expressions, as they relate to us, are intended to identify forward-looking statements. We have based these forward-looking statements largely on our current expectations and projections about future events and financial trends that we believe may affect our financial condition, results of operations, business strategy and financial needs.
The results anticipated by any or all of these forward-looking statements might not occur. Important factors, uncertainties and risks that may cause actual results to differ materially from these forward-looking statements include our ability to obtain the necessary regulatory approvals to launch our future campuses in a timely fashion or at all, the continued ability of our in-house CRM to perform as expected, continued high demand for nurses, the continued effectiveness of our marketing efforts, the effectiveness of our collection efforts and process improvements, national and local economic factors including the substantial impact of the COVID-19 pandemic on our Aspen nursing programs (other than the pre-licensure programs) and the economy, any delays, side effects or other issues occurring in the manufacturing, delivery and administration of COVID-19 vaccines, the competitive impact from the trend of major non-profit and for-profit universities marketing online family nurse practitioner programs, unfavorable regulatory changes, including at the state level, and our failure to continue obtaining enrollments at low acquisition costs and keeping teaching costs down. Further information on the risks and uncertainties affecting our business is contained in our filings with the SEC, including our Prospectus Supplement dated August 31, 2020 and our Annual Report on Form 10-K for the year ended April 30, 2020. We undertake no obligation to publicly update or revise any forward-looking statements, whether as the result of new information, future events or otherwise.
ITEM 3. QUANTITATIVE AND QUALITATIVE DISCLOSURES ABOUT MARKET RISK.
Not applicable.
ITEM 4. CONTROLS AND PROCEDURES.
Evaluation of Disclosure Controls and Procedures
Our management carried out an evaluation, with the participation of our Principal Executive Officer and Principal Financial Officer, required by Rule 13a-15 or 15d-15 of the Securities Exchange Act of 1934 (the “Exchange Act”) of the effectiveness of our disclosure controls and procedures as defined in Rule 13a-15(e) or 15d-15(e) under the Exchange Act. Based on their evaluation, our Principal Executive Officer and Principal Financial Officer concluded that our disclosure controls and
procedures are effective as of the end of the period covered by this report to ensure that information required to be disclosed by us in the reports that we file or submit under the Exchange Act is recorded, processed, summarized and reported within the time periods specified in the SEC’s rules and forms and is accumulated and communicated to our management, including our Principal Executive Officer and Principal Financial Officer, as appropriate to allow timely decisions regarding required disclosure.
Changes in Internal Control Over Financial Reporting
There were no changes in our internal control over financial reporting as defined in Rule 13a-15(f) or 15d-15(f) under the Exchange Act that occurred during the period covered by this report that have materially affected, or are reasonably likely to materially affect, our internal control over financial reporting.
PART II. OTHER INFORMATION
ITEM 1. LEGAL PROCEEDINGS
From time-to-time, we may be involved in litigation relating to claims arising out of our operations in the normal course of business. During the period covered by this report, there were no material changes to the description of legal proceedings set forth in our Annual Report on Form 10-K for the fiscal year ended April 30, 2020.
ITEM 1A. RISK FACTORS
None.
ITEM 2. UNREGISTERED SALES OF EQUITY SECURITIES AND USE OF PROCEEDS
None.
ITEM 3. DEFAULTS UPON SENIOR SECURITIES
None.
ITEM 4. MINE SAFETY DISCLOSURES
Not applicable.
ITEM 5. OTHER INFORMATION
Effective March 16, 2021, the Compensation Committee of the Company’s Board of Directors has adopted resolutions clarifying vesting terms of the RSUs granted to the executive officers of the Company on February 4, 2020, as disclosed in more detail the Current Report on Form 8-K filed on February 10, 2020. Specifically, the RSUs vest on February 4, 2024, subject to accelerated vesting if the closing price of the Company’s common stock on The Nasdaq Global Market is at least $12 per share for 20 consecutive trading days and subject in each case to continued service as an executive officer as of each applicable vesting date.
ITEM 6. EXHIBITS
See the Exhibit Index at the end of this report.
EXHIBIT INDEX
| | | | | | | | | | | | | | | | | | | | | | | | | | | | | | | | |
| | | | Incorporated by Reference | | Filed or
Furnished
Herewith |
| Exhibit # | | Exhibit Description | | Form | | Date | | Number | |
| | Certificate of Incorporation, as amended | | 10-K | | 7/9/19 | | 3.1 | | |
| | Bylaws, as amended | | 10-Q | | 3/15/18 | | 3.2 | | |
| | 2018 Equity Incentive Plan, as amended* | | | | | | | | Filed |
| | Employment Agreement dated December 1, 2020 - Robert Alessi* | | | | | | | | Filed |
| | Certification of Principal Executive Officer (302) | | | | | | | | Filed |
| | Certification of Principal Financial Officer (302) | | | | | | | | Filed |
| | Certification of Principal Executive and Principal Financial Officer (906) | | | | | | | | Furnished** |
| 101.INS | | Inline XBRL Instance Document - the instance document does not appear in the Interactive Data File because its XBRL tags are embedded within the Inline XBRL document | | | | | | | | |
| 101.SCH | | Inline XBRL Taxonomy Extension Schema Document | | | | | | | | Filed |
| 101.CAL | | Inline XBRL Taxonomy Extension Calculation Linkbase Document | | | | | | | | Filed |
| 101.DEF | | Inline XBRL Taxonomy Extension Definition Linkbase Document | | | | | | | | Filed |
| 101.LAB | | Inline XBRL Taxonomy Extension Label Linkbase Document | | | | | | | | Filed |
| 101.PRE | | Inline XBRL Taxonomy Extension Presentation Linkbase Document | | | | | | | | Filed |
| 104 | | Cover Page Interactive Data File (formatted as Inline XBRL and contained in Exhibit 101) | | | | | | | | |
_____________________
* Management contract or compensatory plan or arrangement.
** This exhibit is being furnished rather than filed and shall not be deemed incorporated by reference into any filing, in accordance with Item 601 of Regulation S-K.
Copies of this report (including the financial statements) and any of the exhibits referred to above will be furnished at no cost to our shareholders who make a written request to Aspen Group, Inc., at the address on the cover page of this report, Attention: Corporate Secretary.
SIGNATURES
Pursuant to the requirements of the Securities Exchange Act of 1934, the registrant has duly caused this report to be signed on its behalf by the undersigned hereunto duly authorized.
| | | | | | | | | | | |
| Aspen Group, Inc. | |
| | | |
| March 16, 2021 | By: | /s/ Michael Mathews | |
| | Michael Mathews
Chief Executive Officer
(Principal Executive Officer) | |
| | | | | | | | | | | |
| March 16, 2021 | By: | /s/ Robert Alessi | |
| | Robert Alessi
Chief Financial Officer
(Principal Financial Officer) | |