
EXHIBIT 99.1
FOR IMMEDIATE RELEASE: July 19, 2022
Aspen Group Reports 13% Increase in Revenue to $76.7 million for Fiscal Year 2022
Fourth Quarter 2022 Highlights
| · | Diligent corporate overhead management drives sequential decline in G&A |
| · | Narrowed net loss to $(2.1) million from $(2.3) million |
| · | Adjusted EBITDA, a non-GAAP financial measure, increased to $0.5 million compared to $(1.3) million in third quarter demonstrating leverage in the business model |
NEW YORK – July 19, 2022 - Aspen Group, Inc. (Nasdaq: ASPU) (“AGI”), an education technology holding company, today announced financial results for its fourth quarter and fiscal year ended April 30, 2022.
Fourth Quarter and Full Fiscal Year 2022 Summary Results
| Three months ended April 30, | For the Years Ended April 30, | |||||||||||||||
| $ in millions, except per share data | 2022 | 2021 | 2022 | 2021 | ||||||||||||
| Revenue | $ | 19.4 | $ | 19.1 | $ | 76.7 | $ | 67.8 | ||||||||
| Gross Profit1 | $ | 10.3 | $ | 9.9 | $ | 39.6 | $ | 36.9 | ||||||||
| Gross Margin (%)1 | 53 | % | 52 | % | 52 | % | 54 | % | ||||||||
| Net Income (Loss) | $ | (2.1 | ) | $ | (2.3 | ) | $ | (9.6 | ) | $ | (10.4 | ) | ||||
| Earnings (Loss) per Share | $ | (0.08 | ) | $ | (0.09 | ) | $ | (0.38 | ) | $ | (0.44 | ) | ||||
| EBITDA2 | $ | (0.8 | ) | $ | (1.4 | ) | $ | (5.1 | ) | $ | (6.0 | ) | ||||
| Adjusted EBITDA2 | $ | 0.5 | $ | 0.6 | $ | (1.0 | ) | $ | 1.3 | |||||||
_______________________
1 GAAP gross profit calculation includes marketing and promotional costs, instructional costs and services, and amortization expense of $0.5 million and $0.4 million, and $1.8 million and $1.4 million, for the three months and years ended April 30, 2022 and 2021, respectively.
2 Non-GAAP financial measures. See reconciliations of GAAP to non-GAAP financial measures under "Non-GAAP–Financial Measures" starting on page 5.
“Judicious control of marketing expenses in the fourth quarter led to a narrower net loss, positive Adjusted EBITDA and reduced our cash burn without compromising our ability to achieve our revenue target for the fourth quarter,” said Michael Mathews, Chairman and CEO of AGI. “This performance demonstrates the leverage in our business model and our ability to improve our operating results with controlled spending. In the fourth quarter, we reduced our marketing spend sequentially by $1.0 million to ensure sufficient collateral for a surety bond requested by the State of Arizona. While this reduced enrollments in the fourth quarter, our USU MSN-FNP program was our fastest growing program in the quarter, demonstrating the demand for this high LTV program.
“Our business plans reflect future growth primarily from our new pre-licensure campuses and USU MSN-FNP program, which we believe will offset the near-term absence of core semester starts at the Arizona pre-licensure campuses. More than ever, our country recognizes the critical necessity to replace nurses who have left the field, and the need to grow the nursing population to meet the expected demand of future demographic trends. In addition, more FNPs are needed to meet our country's impending doctor shortage. Aspen Group is well-positioned to benefit from these long-term macro trends.”
Fiscal Q4 2022 Financial and Operational Results (compared to Fiscal Q4 2021)
Revenue increased to $19.4 million compared to $19.1 million. Aspen University’s (AU) revenue, which includes the high LTV BSN Pre-Licensure program, accounted for 66%, or $12.8 million, versus 70%, or $13.3 million of consolidated revenue. United States University (USU) revenue, which includes the high LTV MSN-FNP program, accounted for 34%, or $6.6 million, versus 30%, or $5.7 million, of consolidated revenue.
GAAP gross profit increased 4% to $10.3 million compared to $9.9 million. Gross margin was 53% compared to 52%. AU gross margin remained flat at 52% of AU revenue, and USU gross margin was 61% versus 57% of USU revenue.
AU instructional costs and services represented 27% of AU revenue, and USU instructional costs and services represented 27% of USU revenue. AU marketing and promotional costs represented 18% of AU revenue, while USU marketing and promotional costs represented 11% of USU revenue.
Net loss and net loss per share were ($2.1) million and ($0.08), respectively, compared to ($2.3) million and ($0.09), respectively. AU generated net income of $1.5 million versus $1.4 million, and USU generated net income of $1.3 million versus $1.0 million. AGI corporate incurred a net loss of ($5.0) million as compared to ($4.7) million.
EBITDA, a non-GAAP financial measure, was ($0.8) million and (4%) margin, respectively, compared to EBITDA of ($1.4) million and (8%) margin, respectively. AU generated EBITDA of $2.2 million and 17% margin as compared to $2.2 million and 16% margin. USU generated EBITDA of $1.5 million and 22% margin, as compared to $1.1 million and 19% margin. AGI corporate incurred EBITDA of ($4.5) million as compared to ($4.7) million.
Adjusted EBITDA, a non-GAAP financial measure, was $0.5 million and 3% margin, respectively, compared to Adjusted EBITDA of $0.6 million and 3% margin, respectively. AU generated Adjusted EBITDA of $2.5 million and 20% margin, as compared to $2.6 million and 20% margin. USU generated Adjusted EBITDA of $1.7 million and 26% margin as compared to $1.4 million and 24% margin. AGI corporate incurred Adjusted EBITDA of ($3.7) million as compared to ($3.3) million.
Fiscal Year 2022 Full Year Financial and Operational Results (versus Fiscal Year 2021)
Revenue increased 13% to $76.7 million compared to $67.8 million. AU revenue, which includes the high LTV BSN Pre-Licensure program, accounted for 68%, or $51.8 million, versus 71%, or $47.9 million of consolidated revenue. USU revenue, which includes the high LTV MSN-FNP program, accounted for 32%, or $24.9 million, versus 29%, or $19.9 million.
GAAP Gross profit increased by 7% to $39.6 million, or 52% gross margin, versus $36.9 million, or 54% gross margin. AU gross margin represented 51% versus 55% of AU revenue, and USU gross margin remained flat at 58% of USU revenue.
AU instructional costs and services represented 25% of AU revenue, while USU instructional costs and services represented 26% of USU revenue. AU marketing and promotional costs represented 20% of AU revenue, while USU marketing and promotional costs represented 16% of USU revenue.
Net loss was ($9.6) million and net loss per basic share of ($0.38), versus ($10.4) million and ($0.44) per share. AU generated $6.1 million of net income compared to $7.3 million, and USU generated $3.8 million of net income compared to $2.9 million. AGI corporate incurred a net loss of ($19.5) million compared to ($20.7) million.
EBITDA, a non-GAAP financial measure, was ($5.1) million and (7%) margin, as compared to EBITDA of ($6.0) million and (9%) margin. Adjusted EBITDA, a non-GAAP financial measure, was ($1.0) million and (1%) margin, compared to Adjusted EBITDA of $1.3 million and 2% margin.
AU generated EBITDA of $9.3 million and 18% margin, and Adjusted EBITDA of $10.0 million and 19% margin. USU generated EBITDA of $4.2 million and 17% margin, and Adjusted EBITDA of $4.9 million and 20% margin. AGI corporate incurred EBITDA of ($18.6) million and Adjusted EBITDA of ($15.9) million.
Operating Metrics
New student enrollments at AU decreased 37% year-over-year and at USU by 11% year-over-year. New student enrollments were primarily impacted by the enrollment stoppage at our Phoenix pre-licensure campuses, and the reduction in marketing spend by $1 million over the prior quarter.
New student enrollments for the past five quarters are shown below:
| New Student Quarterly Enrollments | ||||||||||||||||||||
| Q4'21 | Q1'22 | Q2'22 | Q3'22 | Q4'22 | ||||||||||||||||
| Aspen University | 1,593 | 1,601 | 1,750 | 1,301 | 1,010 | |||||||||||||||
| USU | 589 | 675 | 630 | 481 | 525 | |||||||||||||||
| Total | 2,182 | 2,276 | 2,380 | 1,782 | 1,535 | |||||||||||||||
New student enrollments, bookings and ARPU for Q4’22 versus Q4’21 are shown below:
| Fourth Quarter Bookings1 and Average Revenue Per Enrollment (ARPU)1 | ||||||||||||||||
| Q4'21 Enrollments | Q4'21 Bookings | Q4'22 Enrollments | Q4'22 Bookings | |||||||||||||
| (in millions) | (in millions) | |||||||||||||||
| Aspen University | 1,593 | $ | 21.7 | 1,010 | $ | 12.4 | ||||||||||
| USU | 589 | $ | 10.5 | 525 | $ | 9.3 | ||||||||||
| Total | 2,182 | $ | 32.2 | 1,535 | $ | 21.7 | ||||||||||
| ARPU | 14,751 | 14,145 | ||||||||||||||
____________________
1 “Bookings” are defined by multiplying Lifetime Value (LTV) by new student enrollments for each operating unit. “Average Revenue Per Enrollment” (ARPU) is defined by dividing total Bookings by total new student enrollments for each operating unit.
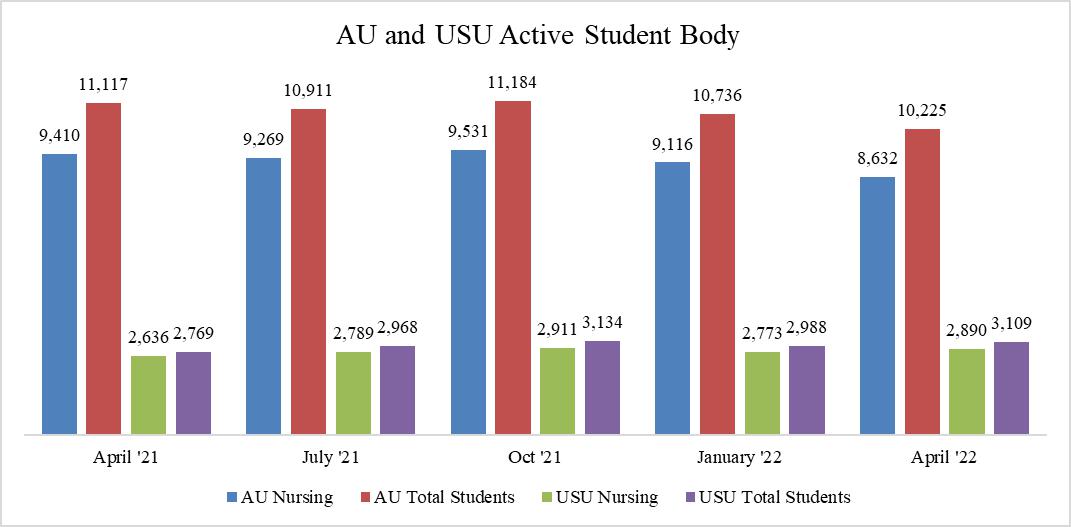
AGI's active degree-seeking student body at AU and USU, declined 4% year-over-year to 13,334 from 13,886. AU's total active student body decreased by 8% year-over-year to 10,225 from 11,117. On a year-over-year basis, USU's total active student body grew by 12% to 3,109 from 2,769. The chart below shows five quarters of active student body results.
Students seeking nursing degrees were 11,522, or 86% of total active students at both universities. Of the students seeking nursing degrees, 9,562 are RNs studying to earn an advanced degree, including 6,672 at Aspen University and 2,890 at USU. In contrast, the remaining 1,960 nursing students are enrolled in Aspen University’s BSN Pre-Licensure program in the Phoenix, Austin, Tampa, Nashville and Atlanta metros. The BSN Pre-Licensure program student body decreased from 2,382 to 1,960 year-over-year or 422 students as a result of the enrollment stoppage in the Phoenix metro.
The chart below shows the breakdown by university nursing students versus total students.
Liquidity
At April 30, 2022, the Company had unrestricted cash of $6.5 million and restricted cash of $6.4 million. Cash used in operations for the year ended April 30, 2022 was $11.3 million. Approximately $1.0 million of the cash used in operations is attributed to our Adjusted EBITDA loss, and the remaining use of operating cash is primarily attributed to increased working capital to support the growth in our monthly payment plans. Additionally, cash used in investing activities for the fiscal year ended April 30, 2022 was $4.2 million. To fund cash used in operations and investing activities, the Company issued $10.0 million of convertible debt and obtained a $20.0 million revolving credit facility.
As previously reported, the Company entered into a Consent Agreement on April 22, 2022 with the Arizona State Board of Nursing, and the Company was subsequently required to obtain an $18.3 million surety bond for the State of Arizona. The Company was required to restrict $5.0 million of cash and reserve its $20.0 million revolving credit facility as collateral for the surety bond. During fiscal Q4 2022, the Company reduced marketing spend, which ensured adequate liquidity to provide collateral for the surety bond. At this time, the Company is currently considering various growth and financing alternatives. Consequently, the Company plans to provide guidance and a financing update for the full fiscal year 2023 at our next earnings call in September.
Conference Call
Aspen Group, Inc. will host a conference call to discuss its fourth quarter and full year fiscal year 2022 results and business outlook on Tuesday, July 19, 2022, at 4:30 pm ET. Aspen Group, Inc. will issue a press release reporting results after the market closes on that day. The conference call can be accessed by dialing toll-free (877) 704-4453 (U.S.) or (201) 389-0920 (International), passcode 13730629.
Subsequent to the call, a transcript of the audio cast will be available from the Company’s website at www.aspu.com. There will also be a seven-day dial-in replay which can be accessed by dialing toll-free (844) 512-2921 (U.S.) or (412) 317-6671 (International), passcode 13730629.
Non-GAAP – Financial Measures
This press release includes both financial measures in accordance with Generally Accepted Accounting Principles, or GAAP, as well as non-GAAP financial measures. Generally, a non-GAAP financial measure is a numerical measure of a company’s performance, financial position or cash flows that either excludes or includes amounts that are not normally included or excluded in the most directly comparable measure calculated and presented in accordance with GAAP. Non-GAAP financial measures should be viewed as supplemental to and should not be considered as alternatives to net income (loss), operating income (loss), and cash flow from operating activities, liquidity or any other financial measures. They may not be indicative of the historical operating results of AGI, nor are they intended to be predictive of potential future results. Investors should not consider non-GAAP financial measures in isolation or as substitutes for performance measures calculated in accordance with GAAP.
Our management uses and relies on EBITDA, Adjusted EBITDA and Adjusted EBITDA Margin, which are non-GAAP financial measures. We believe that management, analysts, and shareholders benefit from referring to the following non-GAAP financial measures to evaluate and assess our core operating results from period-to-period after removing the impact of items that affect comparability. Our management recognizes that the non-GAAP financial measures have inherent limitations because of the excluded items described below.
We have included a reconciliation of our non-GAAP financial measures to the most comparable financial measures calculated in accordance with GAAP. We believe that providing the non-GAAP financial measures, together with the reconciliation to GAAP, helps investors make comparisons between AGI and other companies. In making any comparisons to other companies, investors need to be aware that companies use different non-GAAP measures to evaluate their financial performance. Investors should pay close attention to the specific definition being used and to the reconciliation between such measure and the corresponding GAAP measure provided by each company under applicable SEC rules.
AGI defines Adjusted EBITDA as EBITDA excluding (1) bad debt expense, (2) stock-based compensation, and (3) non-recurring charges. The following table presents a reconciliation of net loss to EBITDA and Adjusted EBITDA and of net income (loss) margin to the Adjusted EBITDA margin:
| Three Months Ended April 30, | For the Years Ended April 30, | |||||||||||||||
| 2022 | 2021 | 2022 | 2021 | |||||||||||||
| Net loss | $ | (2,128,638 | ) | $ | (2,319,986 | ) | $ | (9,585,781 | ) | $ | (10,448,973 | ) | ||||
| Interest expense, net | 364,884 | 13,369 | 715,722 | 2,031,545 | ||||||||||||
| Taxes | 38,880 | (12,446 | ) | 427,400 | 32,644 | |||||||||||
| Depreciation and amortization | 890,228 | 874,111 | 3,370,407 | 2,426,365 | ||||||||||||
| EBITDA | (834,646 | ) | (1,444,952 | ) | (5,072,252 | ) | (5,958,419 | ) | ||||||||
| Bad debt expense | 450,000 | 566,540 | 1,500,000 | 2,268,540 | ||||||||||||
| Stock-based compensation | 569,098 | 382,936 | 2,534,665 | 2,203,822 | ||||||||||||
| Non-recurring charges - Other stock-based compensation | — | 555,321 | — | 1,754,263 | ||||||||||||
| Non-recurring charges - Severance | — | 303,870 | 19,665 | 347,870 | ||||||||||||
| Non-recurring charges - Other | 339,025 | 275,438 | (6,031 | ) | 650,875 | |||||||||||
| Adjusted EBITDA | $ | 523,477 | $ | 639,153 | $ | (1,023,953 | ) | $ | 1,266,951 | |||||||
| Net loss Margin | (11 | )% | (12 | )% | (12 | )% | (15 | )% | ||||||||
| Adjusted EBITDA Margin | 3 | % | 3 | % | (1 | )% | 2 | % |
The following tables present a reconciliation of net loss to EBITDA and Adjusted EBITDA and of net income (loss) margin to the Adjusted EBITDA margin by business unit:
| Three Months Ended April 30, 2022 | ||||||||||||||||
| Consolidated | AGI Corporate | AU | USU | |||||||||||||
| Net income (loss) | $ | (2,128,638 | ) | $ | (4,991,258 | ) | $ | 1,534,709 | $ | 1,327,911 | ||||||
| Interest expense, net | 364,884 | 364,906 | — | (22 | ) | |||||||||||
| Taxes | 38,880 | 20,600 | (22,920 | ) | 41,200 | |||||||||||
| Depreciation and amortization | 890,228 | 61,115 | 726,283 | 102,830 | ||||||||||||
| EBITDA | (834,646 | ) | (4,544,637 | ) | 2,238,072 | 1,471,919 | ||||||||||
| Bad debt expense | 450,000 | — | 225,000 | 225,000 | ||||||||||||
| Stock-based compensation | 569,098 | 500,077 | 51,207 | 17,814 | ||||||||||||
| Non-recurring charges - Other stock-based compensation | — | — | — | — | ||||||||||||
| Non-recurring charges - Severance | — | — | — | — | ||||||||||||
| Non-recurring charges - Other | 339,025 | 339,025 | — | — | ||||||||||||
| Adjusted EBITDA | $ | 523,477 | $ | (3,705,535 | ) | $ | 2,514,279 | $ | 1,714,733 | |||||||
| Net loss Margin | (11 | )% | NM | 12 | % | 20 | % | |||||||||
| Adjusted EBITDA Margin | 3 | % | NM | 20 | % | 26 | % |
_____________________
NM – Not meaningful
| Three Months Ended April 30, 2021 | ||||||||||||||||
| Consolidated | AGI Corporate | AU | USU | |||||||||||||
| Net income (loss) | $ | (2,319,986 | ) | $ | (4,736,579 | ) | $ | 1,388,800 | $ | 1,027,793 | ||||||
| Interest expense, net | 13,369 | 13,486 | — | (117 | ) | |||||||||||
| Taxes | (12,446 | ) | (14,250 | ) | 2,064 | (260 | ) | |||||||||
| Depreciation and amortization | 874,111 | 15,691 | 786,135 | 72,285 | ||||||||||||
| EBITDA | (1,444,952 | ) | (4,721,652 | ) | 2,176,999 | 1,099,701 | ||||||||||
| Bad debt expense | 566,540 | — | 340,000 | 226,540 | ||||||||||||
| Stock-based compensation | 382,936 | 275,938 | 75,605 | 31,393 | ||||||||||||
| Non-recurring charges - Other stock-based compensation | 555,321 | 555,321 | — | — | ||||||||||||
| Non-recurring charges - Severance | 303,870 | 303,870 | — | — | ||||||||||||
| Non-recurring charges - Other | 275,438 | 239,438 | 36,000 | — | ||||||||||||
| Adjusted EBITDA | $ | 639,153 | $ | (3,347,085 | ) | $ | 2,628,604 | $ | 1,357,634 | |||||||
| Net loss Margin | (12 | )% | NM | 10 | % | 18 | % | |||||||||
| Adjusted EBITDA Margin | 3 | % | NM | 20 | % | 24 | % |
| Year Ended April 30, 2022 | ||||||||||||||||
| Consolidated | AGI Corporate | AU | USU | |||||||||||||
| Net income (loss) | $ | (9,585,781 | ) | $ | (19,529,107 | ) | $ | 6,140,416 | $ | 3,802,910 | ||||||
| Interest expense, net | 715,722 | 718,099 | (1,739 | ) | (638 | ) | ||||||||||
| Taxes | 427,400 | 23,963 | 360,947 | 42,490 | ||||||||||||
| Depreciation and amortization | 3,370,407 | 177,835 | 2,809,255 | 383,317 | ||||||||||||
| EBITDA | (5,072,252 | ) | (18,609,210 | ) | 9,308,879 | 4,228,079 | ||||||||||
| Bad debt expense | 1,500,000 | — | 950,000 | 550,000 | ||||||||||||
| Stock-based compensation | 2,534,665 | 2,232,489 | 200,980 | 101,196 | ||||||||||||
| Non-recurring charges - Other stock-based compensation | — | — | — | — | ||||||||||||
| Non-recurring charges - Severance | 19,665 | — | — | 19,665 | ||||||||||||
| Non-recurring charges - Other | (6,031 | ) | 446,660 | (452,691 | ) | — | ||||||||||
| Adjusted EBITDA | $ | (1,023,953 | ) | $ | (15,930,061 | ) | $ | 10,007,168 | $ | 4,898,940 | ||||||
| Net loss Margin | (12 | )% | NM | 12 | % | 15 | % | |||||||||
| Adjusted EBITDA Margin | (1 | )% | NM | 19 | % | 20 | % |
| Year Ended April 30, 2021 | ||||||||||||||||
| Consolidated | AGI Corporate | AU | USU | |||||||||||||
| Net income (loss) | $ | (10,448,973 | ) | $ | (20,666,448 | ) | $ | 7,281,693 | $ | 2,935,782 | ||||||
| Interest expense, net | 2,031,545 | 2,031,745 | — | (200 | ) | |||||||||||
| Taxes | 32,644 | — | 32,644 | — | ||||||||||||
| Depreciation and amortization | 2,426,365 | 57,713 | 2,210,166 | 158,486 | ||||||||||||
| EBITDA | (5,958,419 | ) | (18,576,990 | ) | 9,524,503 | 3,094,068 | ||||||||||
| Bad debt expense | 2,268,540 | — | 1,862,000 | 406,540 | ||||||||||||
| Stock-based compensation | 2,203,822 | 1,845,683 | 210,771 | 147,368 | ||||||||||||
| Non-recurring charges - Other stock-based compensation | 1,754,263 | 1,754,263 | — | — | ||||||||||||
| Non-recurring charges - Severance | 347,870 | 347,870 | — | — | ||||||||||||
| Non-recurring charges - Other | 650,875 | 614,875 | 36,000 | — | ||||||||||||
| Adjusted EBITDA | $ | 1,266,951 | $ | (14,014,299 | ) | $ | 11,633,274 | $ | 3,647,976 | |||||||
| Net loss Margin | (15 | )% | NM | 15 | % | 15 | % | |||||||||
| Adjusted EBITDA Margin | 2 | % | NM | 24 | % | 18 | % |
Definitions
Lifetime Value ("LTV") – is calculated as the weighted average total amount of tuition and fees paid by every new student that enrolls in the Company’s universities, after giving effect to attrition.
Bookings – is defined by multiplying LTV by new student enrollments for each operating unit.
Average Revenue per Enrollment ("ARPU") – is defined by dividing total bookings by total enrollments.
Adjusted EBITDA Margin – is defined as Adjusted EBITDA divided by revenue. We believe Adjusted EBITDA Margin is useful for management, analysts and investors as this measure allows for a more meaningful comparison between our performance and that of our competitors. Adjusted EBITDA Margin has certain limitations in that it does not take into account the impact to our consolidated statement of operations of certain expenses.
Forward-Looking Statements
This press release contains forward-looking statements within the meaning of the Private Securities Litigation Reform Act of 1995 including the expected leverage and ability to improve operating results, programs fueling future growth, monthly payment plan growth, trends in the nursing industry, and our estimates as to Lifetime Value, bookings and ARPU. The words “believe,” “may,” “estimate,” “continue,” “anticipate,” “intend,” “should,” “plan,” “could,” “target,” “potential,” “is likely,” “will,” “expect” and similar expressions, as they relate to us, are intended to identify forward-looking statements. We have based these forward-looking statements largely on our current expectations and projections about future events and financial trends that we believe may affect our financial condition, results of operations, business strategy and financial needs. Important factors that could cause actual results to differ from those in the forward-looking statements include the continued demand of nursing students for the new programs, student attrition, national and local economic factors including the labor market shortages, future NCLEX scores of our students, the failure to obtain approval from the National Council for State Authorization Reciprocity Agreements, competition from nursing schools in local markets, the competitive impact from the trend of major non-profit universities using online education and consolidation among our competitors. Other risks are included in our filings with the SEC including our Form 10-K for the year ended April 30, 2021, as amended by the Form 10-Q for the nine months ended January 31, 2022. Any forward-looking statement made by us herein speaks only as of the date on which it is made. Factors or events that could cause our actual results to differ may emerge from time to time, and it is not possible for us to predict all of them. We undertake no obligation to publicly update any forward-looking statement, whether as a result of new information, future developments or otherwise, except as may be required by law.
About Aspen Group, Inc.
Aspen Group, Inc. is an education technology holding company that leverages its infrastructure and expertise to allow its two universities, Aspen University and United States University, to deliver on the vision of making college affordable again.
Investor Relations Contact
Kim Rogers
Managing Director
Hayden IR
385-831-7337
Kim@HaydenIR.com
GAAP Financial Statements
ASPEN GROUP, INC. AND SUBSIDIARIES
CONSOLIDATED BALANCE SHEETS
| April 30, | ||||||||
| 2022 | 2021 | |||||||
| Assets | ||||||||
| Current assets: | ||||||||
| Cash and cash equivalents | $ | 6,482,750 | $ | 12,472,082 | ||||
| Restricted cash | 6,433,397 | 1,193,997 | ||||||
| Accounts receivable, net of allowance of $3,460,288 and $3,289,816, respectively | 24,359,241 | 16,724,744 | ||||||
| Prepaid expenses | 1,358,635 | 1,077,831 | ||||||
| Other current assets | 748,568 | 68,529 | ||||||
| Total current assets | 39,382,591 | 31,537,183 | ||||||
| Property and equipment: | ||||||||
| Computer equipment and hardware | 1,516,475 | 956,463 | ||||||
| Furniture and fixtures | 2,193,261 | 1,705,101 | ||||||
| Leasehold improvements | 7,179,896 | 5,729,324 | ||||||
| Instructional equipment | 715,652 | 421,039 | ||||||
| Software | 10,285,096 | 8,488,635 | ||||||
| Construction in progress | 2,100 | 247,767 | ||||||
| 21,892,480 | 17,548,329 | |||||||
| Accumulated depreciation and amortization | (8,395,001 | ) | (4,892,987 | ) | ||||
| Property and equipment, net | 13,497,479 | 12,655,342 | ||||||
| Goodwill | 5,011,432 | 5,011,432 | ||||||
| Intangible assets, net | 7,900,000 | 7,908,360 | ||||||
| Courseware, net | 274,047 | 187,296 | ||||||
| Accounts receivable, net of allowance of $0, and $625,963, respectively | — | 45,329 | ||||||
| Long-term contractual accounts receivable | 11,406,525 | 10,249,833 | ||||||
| Deferred financing costs | 369,902 | 18,056 | ||||||
| Operating lease right-of-use assets, net | 12,645,950 | 12,714,863 | ||||||
| Deposits and other assets | 578,125 | 479,212 | ||||||
| Total assets | $ | 91,066,051 | $ | 80,806,906 | ||||
(Continued)
ASPEN GROUP, INC. AND SUBSIDIARIES
CONSOLIDATED BALANCE SHEETS (CONTINUED)
| April 30, | ||||||||
| 2022 | 2021 | |||||||
| Liabilities and Stockholders’ Equity | ||||||||
| Liabilities: | ||||||||
| Current liabilities: | ||||||||
| Accounts payable | $ | 1,893,287 | $ | 1,466,488 | ||||
| Accrued expenses | 2,821,432 | 2,040,896 | ||||||
| Deferred revenue | 5,889,911 | 6,825,014 | ||||||
| Due to students | 4,063,811 | 2,747,484 | ||||||
| Operating lease obligations, current portion | 2,036,570 | 2,029,821 | ||||||
| Other current liabilities | 130,262 | 307,921 | ||||||
| Total current liabilities | 16,835,273 | 15,417,624 | ||||||
| Long-term debt, net | 14,875,735 | — | ||||||
| Operating lease obligations, less current portion | 16,809,319 | 16,298,808 | ||||||
| Total liabilities | 48,520,327 | 31,716,432 | ||||||
| Commitments and contingencies | ||||||||
| Stockholders’ equity: | ||||||||
| Preferred stock, $0.001 par value; 1,000,000 shares authorized, | ||||||||
| 0 issued and 0 outstanding at April 30, 2022 and April 30, 2021 | — | — | ||||||
| Common stock, $0.001 par value; 60,000,000 shares authorized, | ||||||||
| 25,357,764 issued and 25,202,278 outstanding at April 30, 2022 | ||||||||
| 25,066,297 issued and 24,910,811 outstanding at April 30, 2021 | 25,358 | 25,067 | ||||||
| Additional paid-in capital | 112,081,564 | 109,040,824 | ||||||
| Treasury stock (155,486 and 155,486 shares, respectively) | (1,817,414 | ) | (1,817,414 | ) | ||||
| Accumulated deficit | (67,743,784 | ) | (58,158,003 | ) | ||||
| Total stockholders’ equity | 42,545,724 | 49,090,474 | ||||||
| Total liabilities and stockholders’ equity | $ | 91,066,051 | $ | 80,806,906 | ||||
ASPEN GROUP, INC. AND SUBSIDIARIES
CONSOLIDATED STATEMENTS OF OPERATIONS
| Years Ended April 30, | ||||||||
| 2022 | 2021 | |||||||
| Revenue | $ | 76,694,366 | $ | 67,812,520 | ||||
| Operating expenses: | ||||||||
| Cost of revenues (exclusive of depreciation and amortization shown separately below) | 35,259,281 | 29,453,733 | ||||||
| General and administrative | 45,535,001 | 41,908,030 | ||||||
| Bad debt expense | 1,500,000 | 2,268,540 | ||||||
| Depreciation and amortization | 3,370,407 | 2,426,365 | ||||||
| Total operating expenses | 85,664,689 | 76,056,668 | ||||||
| Operating loss | (8,970,323 | ) | (8,244,148 | ) | ||||
| Other income (expense): | ||||||||
| Interest expense | (718,786 | ) | (2,051,381 | ) | ||||
| Other income (expense), net | 530,728 | (120,800 | ) | |||||
| Total other expense, net | (188,058 | ) | (2,172,181 | ) | ||||
| Loss before income taxes | (9,158,381 | ) | (10,416,329 | ) | ||||
| Income tax expense | 427,400 | 32,644 | ||||||
| Net loss | $ | (9,585,781 | ) | $ | (10,448,973 | ) | ||
| Net loss per share - basic and diluted | $ | (0.38 | ) | $ | (0.44 | ) | ||
| Weighted average number of common shares outstanding - basic and diluted | 25,016,437 | 23,757,656 | ||||||
ASPEN GROUP, INC. AND SUBSIDIARIES
CONSOLIDATED STATEMENTS OF CASH FLOWS
| Years Ended April 30, | ||||||||
| 2022 | 2021 | |||||||
| Cash flows from operating activities: | ||||||||
| Net loss | $ | (9,585,781 | ) | $ | (10,448,973 | ) | ||
| Adjustments to reconcile net loss to net cash (used in) provided by operating activities: | ||||||||
| Bad debt expense | 1,500,000 | 2,268,540 | ||||||
| Depreciation and amortization | 3,370,407 | 2,426,365 | ||||||
| Stock-based compensation | 2,534,665 | 3,958,085 | ||||||
| Amortization of warrant-based cost | 59,832 | 36,500 | ||||||
| Amortization of deferred financing costs | 114,751 | 164,362 | ||||||
| Amortization of debt discounts | — | 1,550,854 | ||||||
| Loss on asset disposition | 36,443 | — | ||||||
| Non-cash lease benefit | (230,416 | ) | (27,796 | ) | ||||
| Tenant improvement allowances received from landlords | 816,591 | 4,685,826 | ||||||
| Modification charge for warrants exercised | — | 25,966 | ||||||
| Common stock issued for services | — | 19,900 | ||||||
| Changes in operating assets and liabilities: | ||||||||
| Accounts receivable | (9,203,042 | ) | (8,215,190 | ) | ||||
| Prepaid expenses | (280,804 | ) | (136,160 | ) | ||||
| Other receivables | — | 23,097 | ||||||
| Other current assets | (680,039 | ) | 104,561 | |||||
| Accounts receivable, secured | 45,329 | — | ||||||
| Deposits and other assets | (98,913 | ) | (164,341 | ) | ||||
| Accounts payable | 426,799 | (39,371 | ) | |||||
| Accrued expenses | 780,536 | 1,140,253 | ||||||
| Due to students | 858,010 | 375,640 | ||||||
| Deferred revenue | (1,564,934 | ) | 3,112,020 | |||||
| Other current liabilities | (177,659 | ) | 125,440 | |||||
| Net cash (used in) provided by operating activities | (11,278,225 | ) | 985,578 | |||||
| Cash flows from investing activities: | ||||||||
| Purchase of finite life intangible assets | — | (8,500 | ) | |||||
| Purchases of courseware and accreditation | (167,061 | ) | (120,408 | ) | ||||
| Purchases of property and equipment | (4,160,318 | ) | (8,848,395 | ) | ||||
| Net cash used in investing activities | (4,327,379 | ) | (8,977,303 | ) | ||||
| Cash flows from financing activities: | ||||||||
| Proceeds from drawdown on Credit Facility | 5,000,000 | — | ||||||
| Proceeds from 2022 Convertible Notes | 10,000,000 | — | ||||||
| Payments of deferred financing costs | (335,362 | ) | — | |||||
| Proceeds from warrants exercised | — | 1,081,792 | ||||||
| Proceeds from stock options exercised | 191,034 | 2,669,247 | ||||||
| Net cash provided by financing activities | 14,855,672 | 3,751,039 | ||||||
(Continued)
ASPEN GROUP, INC. AND SUBSIDIARIES
CONSOLIDATED STATEMENTS OF CASH FLOWS (CONTINUED)
| Years Ended April 30, | ||||||||
| 2022 | 2021 | |||||||
| Net decrease in cash and cash equivalents | $ | (749,932 | ) | $ | (4,240,686 | ) | ||
| Cash, cash equivalents and restricted cash at beginning of year | 13,666,079 | 17,906,765 | ||||||
| Cash, cash equivalents and restricted cash at end of year | $ | 12,916,147 | $ | 13,666,079 | ||||
| Supplemental disclosure cash flow information: | ||||||||
| Cash paid for interest | $ | 470,895 | $ | 310,958 | ||||
| Cash paid for income taxes | $ | 27,400 | $ | 57,208 | ||||
| Supplemental disclosure of non-cash investing and financing activities: | ||||||||
| Warrants issued as part of revolving credit facility | $ | 137,500 | $ | — | ||||
| Warrants issued as surety bond consideration | $ | 118,000 | $ | — | ||||
| Common stock issued for conversion of Convertible Notes | $ | — | $ | 10,000,000 | ||||
The following table provides a reconciliation of cash and cash equivalents and restricted cash reported within the consolidated balance sheet that sum to the same such amounts shown in the consolidated statement of cash flows:
| April 30, | ||||||||
| 2022 | 2021 | |||||||
| Cash and cash equivalents | $ | 6,482,750 | $ | 12,472,082 | ||||
| Restricted cash | 6,433,397 | 1,193,997 | ||||||
| Total cash and cash equivalents and restricted cash | $ | 12,916,147 | $ | 13,666,079 | ||||