
EXHIBIT 99.1
FOR IMMEDIATE RELEASE: March 15, 2022
Aspen Group Reports 14% Revenue Growth for Third Quarter Fiscal 2022
| · | Revenue increased to $18.9 million compared to $16.6 million last year |
| · | Business units with highest Lifetime Value (LTV) programs accounted for 56% of revenue |
| · | Net loss of ($3.7) million, including losses of $1.3 million related to new campus expansion |
| · | Received approval to open BSN Pre-Licensure program in Atlanta |
NEW YORK – March 15, 2022 - Aspen Group, Inc. (Nasdaq: ASPU) (“AGI”), an education technology holding company, today announced financial results for its third quarter fiscal year 2022 ended January 31, 2022.
Third Quarter Fiscal Year 2022 Summary Results
| Three Months Ended January 31, | Nine Months Ended January 31, | |||||||||||||||
| $ in millions, except per share data | 2022 | 2021 | 2022 | 2021 | ||||||||||||
| Revenue | $ | 18.9 | $ | 16.6 | $ | 57.3 | $ | 48.8 | ||||||||
| Gross Profit1 | $ | 9.2 | $ | 8.7 | $ | 29.3 | $ | 27.0 | ||||||||
| Gross Margin (%)1 | 49 | % | 52 | % | 51 | % | 55 | % | ||||||||
| Net Income (Loss) | $ | (3.7 | ) | $ | (2.8 | ) | $ | (7.5 | ) | $ | (8.1 | ) | ||||
| Earnings (Loss) per Share | $ | (0.15 | ) | $ | (0.11 | ) | $ | (0.30 | ) | $ | (0.35 | ) | ||||
| EBITDA2 | $ | (2.4 | ) | $ | (2.2 | ) | $ | (4.2 | ) | $ | (4.5 | ) | ||||
| Adjusted EBITDA2 | $ | (1.3 | ) | $ | (0.9 | ) | $ | (1.5 | ) | $ | 0.6 | |||||
_______________________
1 GAAP gross profit calculation includes marketing and promotional costs, instructional costs and services, and amortization expense of $0.4 million and $1.3 million, and $0.4 million and $1.0 million, for the three and nine months ended January 31, 2022 and 2021, respectively.
2 Non-GAAP financial measure. See reconciliations of GAAP to non-GAAP financial measures under "Non-GAAP–Financial Measures" starting on page 5.
“For the third quarter, Aspen Group delivered a 14% revenue increase year-over-year, despite the spike in Covid-19 infection rates driven by the Omicron variant, which caused critical healthcare staffing shortages and workload overloads for RNs during the quarter, lowering post-licensure degree program class starts amongst our predominantly RN student body,” said Michael Mathews, Chairman and CEO of AGI. “Importantly though, as the Omicron variant subsides, there are clear and prevailing longer-term trends in nursing that underpin robust demand for our offerings and reinforce our optimism for driving revenue growth and margin improvement. A growing number of nurses are leaving the profession as they reach retirement age or due to the pandemic-induced job fatigue. This supply-side trend, coupled with the rising demand for healthcare to support the aging U.S. population, is expected to perpetuate a nursing shortage through 2030. Registered nursing is one of the highest in-demand professions in the American workforce, and our EdTech platform puts us in a solid position to serve this growing market in an affordable way for students. Our recently improved balance sheet supports our long-term growth objectives.”
COVID-19 Update
Nursing students represented 87% of the Company’s total student body at the end of the third quarter of fiscal 2022. Of the 11,889 nursing students, 2,277 are BSN Pre-Licensure students located across our four metro locations (Phoenix, Austin, Tampa, and Nashville). The remaining 9,612 nursing students are licensed registered nurses (RNs) studying to earn an advanced degree (RN to BSN, MSN, MSN-FNP, or DNP degree programs). Post-licensure nursing students represent 70% of the Company’s total student body at the end of the third quarter and are the AGI students primarily affected by the COVID-19 pandemic.
Starting in the second half of June 2021 and continuing through January 2022, the Company saw lower course starts than seasonally expected among our RN student body. For example, at Aspen University, course starts among RNs from June 2021 through January 2022 increased by approximately 3% year-over-year. By comparison, over the previous two full fiscal years (Fiscal Year 2021 and Fiscal Year 2020), course starts among RNs at Aspen University increased by an average of approximately 10% year-over-year.
Aspen Group cannot be certain what impact future COVID-19 variants will have on the Company’s results through the remainder of Fiscal Year 2022 and into Fiscal Year 2023.
Liquidity
At January 31, 2022, the Company had cash and cash equivalents of $6.0 million, restricted cash of $1.4 million. Cash used in operations for the nine months ended January 31, 2022 was $7.7 million, which is attributed to changes in working capital to support increased revenue.
Earlier today, the Company announced financing agreements consisting of a $10 million convertible note and a $20 million revolving credit facility. Aspen Group received the proceeds of the convertible note at the closing. The $20 million revolving credit facility is undrawn. Additionally, the Company extended its existing $5 million Revolving Credit Facility by one year to November 4, 2023.
Updated Outlook for Fiscal Year 2022
The Company has revised its outlook for fiscal year 2022 revenue to a new range of $75.5 million to $77.5 million range from the prior range of $77.0 million to $80.0 million given in the second quarter fiscal 2022 earnings release on December 14, 2021.
The table below shows the revised forecast for fiscal year 2022 guidance metrics.
| Dollar amounts in millions, except per share data | Prior Guidance Range | Revised Guidance Range | ||||||||||||||
| Revenue | $ | 77.0 | $ | 80.0 | $ | 75.5 | $ | 77.5 | ||||||||
| Net Income (Loss) | $ | (9.0 | ) | $ | (7.0 | ) | $ | (11.5 | ) | $ | (10.5 | ) | ||||
| GAAP Earnings (Loss) per Share | $ | (0.38 | ) | $ | (0.29 | ) | $ | (0.46 | ) | $ | (0.42 | ) | ||||
| EBITDA1 | $ | (5.0 | ) | $ | (3.0 | ) | $ | (7.5 | ) | $ | (6.5 | ) | ||||
| Adjusted EBITDA1 | $ | (2.0 | ) | $ | 0.0 | $ | (3.5 | ) | $ | (2.5 | ) | |||||
1 See definitions of these Non-GAAP financial measures under "Non-GAAP–Financial Measures" starting on page 5. The guidance reconciliation follows a similar format.
Fiscal Q3 2022 Financial and Operational Results (compared to Fiscal Q3 2021)
Revenue increased to $18.9 million for Fiscal Q3 2022 compared to $16.6 million for Fiscal Q3 2021. Aspen University’s (AU) revenue in the third quarter of fiscal year 2022, which includes the high LTV BSN Pre-Licensure program, accounted for 69%, or $13.0 million, versus 71% or $11.9 million, of consolidated revenue in the prior year period. United States University (USU) revenue for the quarter, which includes the high LTV MSN-FNP program, accounted for 31%, or $5.9 million versus 29%, or $4.8 million of consolidated revenue in the prior year period.
GAAP gross profit increased 6% to $9.2 million for Fiscal Q3 2022 compared to $8.7 million for Fiscal Q3 2021. Gross margin was 49% for Fiscal Q3 2022 compared to 52% for Fiscal Q3 2021. Gross margin in Fiscal Q3 2022 was impacted by higher instructional and marketing costs related to the new locations within the BSN Pre-Licensure program. AU gross margin was 50% of AU revenue for Fiscal Q3 2022 versus 54% in Fiscal Q3 2021, and USU gross margin was 52% of USU revenue for Fiscal Q3 2022 versus 53% in Fiscal Q3 2021.
Net loss and net loss per share were ($3.7) million and ($0.15), respectively, for Fiscal Q3 2022 compared to ($2.8) million and ($0.11), respectively, for Fiscal Q3 2021. AU generated net income of $0.9 million for Fiscal Q3 2022 versus $1.4 million in Fiscal Q3 2021, and USU generated net income of $0.3 million for each Fiscal Q3 2022 and Fiscal Q3 2021. AGI corporate incurred a net loss of ($5.0) million for Fiscal Q3 2022 as compared to ($4.5) million in the prior year period.
EBITDA was ($2.4) million and (13%) margin, respectively, for Fiscal Q3 2022 compared to EBITDA of ($2.2) million and (13%) margin, respectively, for Fiscal Q3 2021.
For Fiscal Q3 2022, AU generated EBITDA of $1.9 million and 15% margin as compared to $1.9 million or 16% margin in Fiscal Q3 2021. USU generated EBITDA of $0.4 million and 7% margin, as compared to $0.4 million or 8% margin in Fiscal Q3 2021. AGI corporate incurred EBITDA of ($4.8) million as compared to ($4.5) million in Fiscal Q3 2021.
Adjusted EBITDA was ($1.3) million and (7%) margin, respectively, for Fiscal Q3 2022 compared to Adjusted EBITDA of ($0.9) million and (5%) margin, respectively, for Fiscal Q3 2021.
For Fiscal Q3 2022, AU generated Adjusted EBITDA of $2.2 million and 17% margin, as compared to $2.5 million, or 21% margin, in Fiscal Q3 2021. USU generated Adjusted EBITDA of $0.6 million and 10% margin, as compared to $0.5 million, or 10% margin, in Fiscal Q3 2021. AGI corporate incurred Adjusted EBITDA of ($4.1) million as compared to ($3.8) million in Fiscal Q3 2021.
Operating Metrics
New student enrollments for the past five quarters are shown below:
| New Student Quarterly Enrollments | ||||||||||||||||||||
| Q3'21 | Q4'21 | Q1'22 | Q2'22 | Q3'22 | ||||||||||||||||
| Aspen University | 1,593 | 1,593 | 1,601 | 1,750 | 1,301 | |||||||||||||||
| USU | 536 | 589 | 675 | 630 | 481 | |||||||||||||||
| Total | 2,129 | 2,182 | 2,276 | 2,380 | 1,782 | |||||||||||||||
New student enrollments, bookings and ARPU for Q3’22 compared to Q3’21 are shown below:
| Q3'21 Enrollments | Q3'21 Bookings 1 | Q3'22 Enrollments | Q3'22 Bookings 1 | |||||||||||||
| (in millions) | (in millions) | |||||||||||||||
| Aspen University | 1,593 | $ | 23.5 | 1,301 | $ | 17.8 | ||||||||||
| USU | 536 | $ | 9.6 | 481 | $ | 8.6 | ||||||||||
| Total | 2,129 | $ | 33.0 | 1,782 | $ | 26.3 | ||||||||||
| ARPU | $ | 15,513 | $ | 14,785 | ||||||||||||
_____________________
1 “Bookings” are defined by multiplying Lifetime Value (LTV) by new student enrollments for each operating unit. “Average Revenue Per Enrollment” (ARPU) is defined by dividing total Bookings by total new student enrollments for each operating unit.
New student enrollments at AU decreased year-over-year by 18% due to the planned reduction of BSN Pre-Licensure enrollments in the Phoenix metro and the impact of COVID-19, specifically the effect that the Omicron variant surge has had among prospective RN students beginning in November 2021. New student enrollments at USU decreased by 10% year-over-year. RN student enrollments at USU were similarly impacted by COVID-19.
To provide context, the third quarter enrollment decrease of 16% year-over-year on a Company-wide basis was primarily a result of three factors:
| · | First, as previously disclosed, Aspen University reduced advertising spend in the Phoenix metro for the BSN pre-licensure program to a maintenance spend level through January, causing enrollments in that metro to drop by 51% year-over-year. The quarter was not affected by the temporary suspension of advertising and enrollments of new pre-licensure students in the Phoenix metro, which happened after the quarter closed. |
| · | Second, enrollments at USU were down 10% year-over-year given the impact of the ongoing COVID-19 pandemic, as prospective post-licensure nursing students continue to delay their education goals on a short-term basis as they cared for COVID patients. |
| · | Third, in addition to Aspen University also seeing a COVID effect among prospective nursing post-licensure students, Aspen’s 2.0 business plan called for a $1.3 million annual reduction of ad spend in fiscal 2022 in Aspen’s post-licensure Nursing + Other unit. In the third quarter this equated to a 14% drop in ad spend year-over-year. Consequently, given the drop in ad spend and the COVID effect, enrollments in the Aspen Nursing + Other unit dropped by 18% year-over-year. |
In summary, excluding the 51% drop in enrollments in the Phoenix metro (BSN pre-licensure program) and the 18% drop in enrollments in Aspen University's Nursing + Other unit, total enrollments for the Company would have been down by approximately 1% year-over-year.
The chart below shows five quarters of active student body results. Active student body is comprised of active degree-seeking students, enrolled in a course at the end of the third quarter of fiscal year 2022 or are registered for an upcoming course.
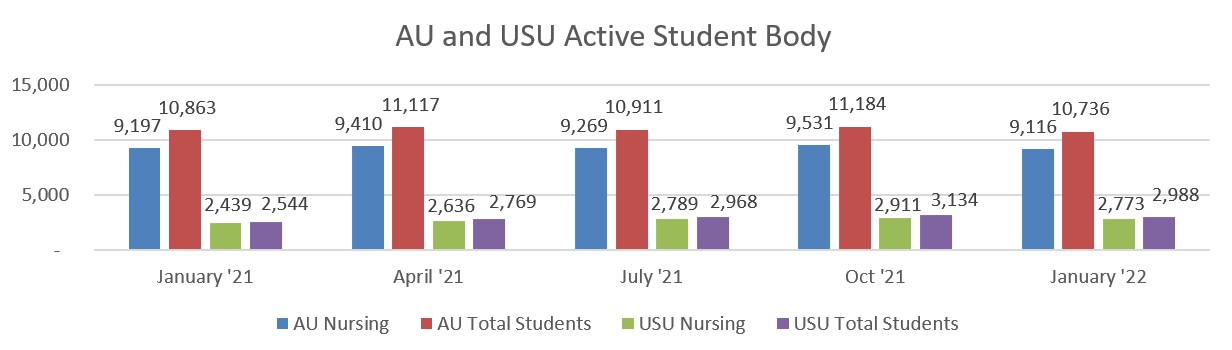
AGI’s overall active degree-seeking student body (includes both Aspen University and USU) grew 2% year-over-year to 13,724 as of January 31, 2022 from 13,407 as of January 31, 2021 and students seeking nursing degrees were 11,889 or 87% of total active students at both universities. Of the 11,889 students seeking nursing degrees, 9,612 are RNs studying to earn an advanced degree, including 6,839 at Aspen University and 2,773 at USU, while the remaining 2,277 nursing students are enrolled in Aspen University’s BSN Pre-Licensure program in the Phoenix, Austin, Tampa, Nashville and Atlanta metros.
Conference Call
Aspen Group, Inc. will host a conference call to discuss its third quarter fiscal year 2022 results and business outlook on Tuesday, March 15, 2022, at 4:30 pm ET. Aspen Group, Inc. will issue a press release reporting results after the market closes on that day. The conference call can be accessed by dialing toll-free (844) 452-6823 (U.S.) or (731) 256-5216 (International), passcode 9807158.
Subsequent to the call, a transcript of the audio cast will be available from the Company’s website at www.aspu.com. There will also be a seven day dial-in replay which can be accessed by dialing toll-free (855) 859-2056 (U.S.) or (404) 537-3406 (International), passcode 9807158.
For additional information on the financial statements and performance, please refer to the Aspen Group, Inc. Form 10-Q for the third quarter of fiscal year 2022 and third quarter 2022 Financial Results Presentation published on the Company’s website at www.aspu.com, on the Presentations page under Company Info.
Non-GAAP – Financial Measures
This press release includes both financial measures in accordance with Generally Accepted Accounting Principles, or GAAP, as well as non-GAAP financial measures. Generally, a non-GAAP financial measure is a numerical measure of a company’s performance, financial position or cash flows that either excludes or includes amounts that are not normally included or excluded in the most directly comparable measure calculated and presented in accordance with GAAP. Non-GAAP financial measures should be viewed as supplemental to, and should not be considered as alternatives to net income (loss), operating income (loss), and cash flow from operating activities, liquidity or any other financial measures. They may not be indicative of the historical operating results of AGI nor are they intended to be predictive of potential future results. Investors should not consider non-GAAP financial measures in isolation or as substitutes for performance measures calculated in accordance with GAAP.
Our management uses and relies on EBITDA, Adjusted EBITDA and Adjusted EBITDA Margin, which are non-GAAP financial measures. We believe that management, analysts, and shareholders benefit from referring to the following non-GAAP financial measures to evaluate and assess our core operating results from period-to-period after removing the impact of items that affect comparability. Our management recognizes that the non-GAAP financial measures have inherent limitations because of the excluded items described below.
We have included a reconciliation of our non-GAAP financial measures to the most comparable financial measures calculated in accordance with GAAP. We believe that providing the non-GAAP financial measures, together with the reconciliation to GAAP, helps investors make comparisons between AGI and other companies. In making any comparisons to other companies, investors need to be aware that companies use different non-GAAP measures to evaluate their financial performance. Investors should pay close attention to the specific definition being used and to the reconciliation between such measure and the corresponding GAAP measure provided by each company under applicable SEC rules.
AGI defines Adjusted EBITDA as EBITDA excluding: (1) bad debt expense; (2) stock-based compensation; and (3) non-recurring charges. The following table presents a reconciliation of net loss to EBITDA and Adjusted EBITDA and of net income (loss) margin to the Adjusted EBITDA margin:
| Three Months Ended January 31, | Nine Months Ended January 31, | |||||||||||||||
| 2022 | 2021 | 2022 | 2021 | |||||||||||||
| Net loss | $ | (3,733,997 | ) | $ | (2,815,266 | ) | $ | (7,457,143 | ) | $ | (8,128,987 | ) | ||||
| Interest expense, net | 180,642 | 33,436 | 350,838 | 2,018,176 | ||||||||||||
| Taxes | 231,610 | 10,460 | 388,520 | 45,090 | ||||||||||||
| Depreciation and amortization | 883,536 | 535,273 | 2,480,179 | 1,552,254 | ||||||||||||
| EBITDA | (2,438,209 | ) | (2,236,097 | ) | (4,237,606 | ) | (4,513,467 | ) | ||||||||
| Bad debt expense | 350,000 | 670,000 | 1,050,000 | 1,702,000 | ||||||||||||
| Stock-based compensation | 700,697 | 701,170 | 1,965,567 | 3,019,828 | ||||||||||||
| Non-recurring charges - Severance | — | — | 19,665 | 44,000 | ||||||||||||
| Non-recurring (income) charges - Other | 49,310 | — | (345,056 | ) | 375,437 | |||||||||||
| Adjusted EBITDA | $ | (1,338,202 | ) | $ | (864,927 | ) | $ | (1,547,430 | ) | $ | 627,798 | |||||
| Net loss Margin | (20 | )% | (17 | )% | (13 | )% | (17 | )% | ||||||||
| Adjusted EBITDA Margin | (7 | )% | (5 | )% | (3 | )% | 1 | % | ||||||||
The following tables present a reconciliation of net loss to EBITDA and Adjusted EBITDA and of net income (loss) margin to the Adjusted EBITDA margin by business unit:
| Three Months Ended January 31, 2022 | ||||||||||||||||
| Consolidated | AGI Corporate | AU | USU | |||||||||||||
| Net income (loss) | $ | (3,733,997 | ) | $ | (5,020,149 | ) | $ | 941,437 | $ | 344,715 | ||||||
| Interest expense, net | 180,642 | 180,682 | — | (40 | ) | |||||||||||
| Taxes | 231,610 | 951 | 230,660 | (1 | ) | |||||||||||
| Depreciation and amortization | 883,536 | 47,536 | 738,172 | 97,828 | ||||||||||||
| EBITDA | (2,438,209 | ) | (4,790,980 | ) | 1,910,269 | 442,502 | ||||||||||
| Bad debt expense | 350,000 | — | 225,000 | 125,000 | ||||||||||||
| Stock-based compensation | 700,697 | 616,166 | 56,880 | 27,651 | ||||||||||||
| Non-recurring charges - Severance | — | — | — | — | ||||||||||||
| Non-recurring charges - Other | 49,310 | 49,310 | — | — | ||||||||||||
| Adjusted EBITDA | $ | (1,338,202 | ) | $ | (4,125,504 | ) | $ | 2,192,149 | $ | 595,153 | ||||||
| Net income (loss) Margin | (20 | )% | NM | 7 | % | 6 | % | |||||||||
| Adjusted EBITDA Margin | (7 | )% | NM | 17 | % | 10 | % | |||||||||
________________________________
NM - Not meaningful
| Three Months Ended January 31, 2021 | ||||||||||||||||
| Consolidated | AGI Corporate | AU | USU | |||||||||||||
| Net income (loss) | $ | (2,815,266 | ) | $ | (4,537,882 | ) | $ | 1,375,359 | $ | 347,257 | ||||||
| Interest expense, net | 33,436 | 33,516 | — | (80 | ) | |||||||||||
| Taxes | 10,460 | 3,600 | 6,800 | 60 | ||||||||||||
| Depreciation and amortization | 535,273 | 15,540 | 492,303 | 27,430 | ||||||||||||
| EBITDA | (2,236,097 | ) | (4,485,226 | ) | 1,874,462 | 374,667 | ||||||||||
| Bad debt expense | 670,000 | — | 610,000 | 60,000 | ||||||||||||
| Stock-based compensation | 701,170 | 692,244 | (12,468 | ) | 21,394 | |||||||||||
| Non-recurring charges - Severance | — | — | — | — | ||||||||||||
| Non-recurring charges - Other | — | — | — | — | ||||||||||||
| Adjusted EBITDA | $ | (864,927 | ) | $ | (3,792,982 | ) | $ | 2,471,994 | $ | 456,061 | ||||||
| Net income (loss) Margin | (17 | )% | NM | 12 | % | 7 | % | |||||||||
| Adjusted EBITDA Margin | (5 | )% | NM | 21 | % | 10 | % | |||||||||
| Nine Months Ended January 31, 2022 | ||||||||||||||||
| Consolidated | AGI Corporate | AU | USU | |||||||||||||
| Net income (loss) | $ | (7,457,143 | ) | $ | (14,537,849 | ) | $ | 4,605,707 | $ | 2,474,999 | ||||||
| Interest expense, net | 350,838 | 353,193 | (1,739 | ) | (616 | ) | ||||||||||
| Taxes | 388,520 | 3,363 | 383,867 | 1,290 | ||||||||||||
| Depreciation and amortization | 2,480,179 | 116,720 | 2,082,972 | 280,487 | ||||||||||||
| EBITDA | (4,237,606 | ) | (14,064,573 | ) | 7,070,807 | 2,756,160 | ||||||||||
| Bad debt expense | 1,050,000 | — | 725,000 | 325,000 | ||||||||||||
| Stock-based compensation | 1,965,567 | 1,732,412 | 149,773 | 83,382 | ||||||||||||
| Non-recurring charges - Severance | 19,665 | — | — | 19,665 | ||||||||||||
| Non-recurring (income) charges - Other | (345,056 | ) | 107,635 | (452,691 | ) | — | ||||||||||
| Adjusted EBITDA | $ | (1,547,430 | ) | $ | (12,224,526 | ) | $ | 7,492,889 | $ | 3,184,207 | ||||||
| Net income (loss) Margin | (13 | )% | NM | 12 | % | 14 | % | |||||||||
| Adjusted EBITDA Margin | (3 | )% | NM | 19 | % | 17 | % | |||||||||
| Nine Months Ended January 31, 2021 | ||||||||||||||||
| Consolidated | AGI Corporate | AU | USU | |||||||||||||
| Net income (loss) | $ | (8,128,987 | ) | $ | (15,929,868 | ) | $ | 5,892,892 | $ | 1,907,989 | ||||||
| Interest expense, net | 2,018,176 | 2,018,258 | — | (82 | ) | |||||||||||
| Taxes | 45,090 | 14,250 | 30,580 | 260 | ||||||||||||
| Depreciation and amortization | 1,552,254 | 42,023 | 1,424,030 | 86,201 | ||||||||||||
| EBITDA | (4,513,467 | ) | (13,855,337 | ) | 7,347,502 | 1,994,368 | ||||||||||
| Bad debt expense | 1,702,000 | — | 1,522,000 | 180,000 | ||||||||||||
| Stock-based compensation | 3,019,828 | 2,768,687 | 135,166 | 115,975 | ||||||||||||
| Non-recurring charges - Severance | 44,000 | 44,000 | — | — | ||||||||||||
| Non-recurring charges - Other | 375,437 | 375,437 | — | — | ||||||||||||
| Adjusted EBITDA | $ | 627,798 | $ | (10,667,213 | ) | $ | 9,004,668 | $ | 2,290,343 | |||||||
| Net income (loss) Margin | (17 | )% | NM | 17 | % | 14 | % | |||||||||
| Adjusted EBITDA Margin | 1 | % | NM | 26 | % | 16 | % | |||||||||
Definitions
Lifetime Value ("LTV") – is calculated as the weighted average total amount of tuition and fees paid by every new student that enrolls in the Company’s universities, after giving effect to attrition.
Bookings – is defined by multiplying LTV by new student enrollments for each operating unit.
Average Revenue per Enrollment ("ARPU") – is defined by dividing total bookings by total enrollments.
Adjusted EBITDA Margin – is defined as Adjusted EBITDA divided by revenue. We believe Adjusted EBITDA margin is useful for management, analysts and investors as this measure allows for a more meaningful comparison between our performance and that of our competitors. Adjusted EBITDA margin has certain limitations in that it does not take into account the impact to our consolidated statement of operations of certain expenses.
Forward-Looking Statements
This press release contains forward-looking statements within the meaning of the Private Securities Litigation Reform Act of 1995 including the nursing shortage, our 2022 guidance, our liquidity, the impact of COVID-19 on our business including our RN to BSN program and our estimates as to Lifetime Value, bookings and ARPU. The words “believe,” “may,” “estimate,” “continue,” “anticipate,” “intend,” “should,” “plan,” “could,” “target,” “potential,” “is likely,” “will,” “expect” and similar expressions, as they relate to us, are intended to identify forward-looking statements. We have based these forward-looking statements largely on our current expectations and projections about future events and financial trends that we believe may affect our financial condition, results of operations, business strategy and financial needs. Important factors that could cause actual results to differ from those in the forward-looking statements include the continued demand of nursing students for the new programs, student attrition, national and local economic factors including whether COVID-19 will continue to have an adverse effect on the economy, uncertainties arising from the Russian invasion of Ukraine including its effect on the U.S. economy, supply chain issues and the labor market, competition from nursing schools in local markets, the competitive impact from the trend of non-profit universities using online education and consolidation among our competitors, and the impact of possible actions arising from the Arizona Board of Nursing investigation. Other risks are included in our filings with the SEC including our Form 10-K for the year ended April 30, 2021, as amended by the Form 10-Q for the fiscal quarter ended January 31, 2022. Any forward-looking statement made by us herein speaks only as of the date on which it is made. Factors or events that could cause our actual results to differ may emerge from time to time, and it is not possible for us to predict all of them. We undertake no obligation to publicly update any forward-looking statement, whether as a result of new information, future developments or otherwise, except as may be required by law.
About Aspen Group, Inc.
Aspen Group, Inc. is an education technology holding company that leverages its infrastructure and expertise to allow its two universities, Aspen University and United States University, to deliver on the vision of making college affordable again.
Investor Relations Contact
Kim Rogers
Managing Director
Hayden IR
385-831-7337
Kim@HaydenIR.com
GAAP Financial Statements
ASPEN GROUP, INC. AND SUBSIDIARIES
CONSOLIDATED BALANCE SHEETS
| January 31, 2022 | April 30, 2021 | |||||||
| (Unaudited) | ||||||||
| Assets | ||||||||
| Current assets: | ||||||||
| Cash and cash equivalents | $ | 5,969,286 | $ | 12,472,082 | ||||
| Restricted cash | 1,433,397 | 1,193,997 | ||||||
| Accounts receivable, net of allowance of $3,381,204 and $3,289,816, respectively | 19,635,715 | 16,724,744 | ||||||
| Prepaid expenses | 1,375,628 | 1,077,831 | ||||||
| Other current assets | 31,032 | 68,529 | ||||||
| Total current assets | 28,445,058 | 31,537,183 | ||||||
| Property and equipment: | ||||||||
| Computer equipment and hardware | 1,486,201 | 956,463 | ||||||
| Furniture and fixtures | 2,153,124 | 1,705,101 | ||||||
| Leasehold improvements | 7,179,896 | 5,729,324 | ||||||
| Instructional equipment | 656,409 | 421,039 | ||||||
| Software | 9,829,329 | 8,488,635 | ||||||
| Construction in progress | 900 | 247,767 | ||||||
| 21,305,859 | 17,548,329 | |||||||
| Less: accumulated depreciation and amortization | (7,533,571 | ) | (4,892,987 | ) | ||||
| Total property and equipment, net | 13,772,288 | 12,655,342 | ||||||
| Goodwill | 5,011,432 | 5,011,432 | ||||||
| Intangible assets, net | 7,907,075 | 7,908,360 | ||||||
| Courseware, net | 289,680 | 187,296 | ||||||
| Accounts receivable, net of allowance of $— and $625,963, respectively | — | 45,329 | ||||||
| Long-term contractual accounts receivable | 12,701,452 | 10,249,833 | ||||||
| Deferred financing costs | 88,393 | 18,056 | ||||||
| Operating lease right of use assets, net | 13,090,470 | 12,714,863 | ||||||
| Deposits and other assets | 523,898 | 479,212 | ||||||
| Total assets | $ | 81,829,746 | $ | 80,806,906 | ||||
(Continued)
ASPEN GROUP, INC. AND SUBSIDIARIES
CONSOLIDATED BALANCE SHEETS (CONTINUED)
| January 31, 2022 | April 30, 2021 | |||||||
| (Unaudited) | ||||||||
| Liabilities and Stockholders’ Equity | ||||||||
| Liabilities: | ||||||||
| Current liabilities: | ||||||||
| Accounts payable | $ | 1,806,656 | $ | 1,466,488 | ||||
| Accrued expenses | 2,079,249 | 2,040,896 | ||||||
| Deferred revenue | 6,182,781 | 6,825,014 | ||||||
| Due to students | 3,229,516 | 2,747,484 | ||||||
| Operating lease obligations, current portion | 2,106,981 | 2,029,821 | ||||||
| Credit Facility | 5,000,000 | — | ||||||
| Other current liabilities | 136,027 | 307,921 | ||||||
| Total current liabilities | 20,541,210 | 15,417,624 | ||||||
| Operating lease obligations, less current portion | 17,317,396 | 16,298,808 | ||||||
| Total liabilities | 37,858,606 | 31,716,432 | ||||||
| Commitments and contingencies | ||||||||
| Stockholders’ equity: | ||||||||
| Preferred stock, $0.001 par value; 1,000,000 shares authorized, | ||||||||
| 0 issued and 0 outstanding at January 31, 2022 and April 30, 2021 | — | — | ||||||
| Common stock, $0.001 par value; 40,000,000 shares authorized, | ||||||||
| 25,228,580 issued and 25,073,094 outstanding at January 31, 2022 | ||||||||
| 25,066,297 issued and 24,910,811 outstanding at April 30, 2021 | 25,229 | 25,067 | ||||||
| Additional paid-in capital | 111,378,471 | 109,040,824 | ||||||
| Treasury stock (155,486 at both January 31, 2022 and April 30, 2021) | (1,817,414 | ) | (1,817,414 | ) | ||||
| Accumulated deficit | (65,615,146 | ) | (58,158,003 | ) | ||||
| Total stockholders’ equity | 43,971,140 | 49,090,474 | ||||||
| Total liabilities and stockholders’ equity | $ | 81,829,746 | $ | 80,806,906 | ||||
ASPEN GROUP, INC. AND SUBSIDIARIES
CONSOLIDATED STATEMENTS OF OPERATIONS
(Unaudited)
| Three Months Ended January 31, | Nine Months Ended January 31, | |||||||||||||||
| 2022 | 2021 | 2022 | 2021 | |||||||||||||
| Revenue | $ | 18,944,798 | $ | 16,624,837 | $ | 57,316,004 | $ | 48,761,444 | ||||||||
| Operating expenses: | ||||||||||||||||
| Cost of revenue (exclusive of depreciation and amortization shown separately below) | 9,275,419 | 7,559,951 | 26,658,188 | 20,732,254 | ||||||||||||
| General and administrative | 11,771,487 | 10,644,438 | 34,359,276 | 30,723,349 | ||||||||||||
| Bad debt expense | 350,000 | 670,000 | 1,050,000 | 1,702,000 | ||||||||||||
| Depreciation and amortization | 883,536 | 535,273 | 2,480,179 | 1,552,254 | ||||||||||||
| Total operating expenses | 22,280,442 | 19,409,662 | 64,547,643 | 54,709,857 | ||||||||||||
| Operating loss | (3,335,644 | ) | (2,784,825 | ) | (7,231,639 | ) | (5,948,413 | ) | ||||||||
| Other income (expense): | ||||||||||||||||
| Interest expense | (180,697 | ) | (33,539 | ) | (353,738 | ) | (2,018,664 | ) | ||||||||
| Other income (expense), net | 13,954 | 13,558 | 516,754 | (116,820 | ) | |||||||||||
| Total other (expense) income, net | (166,743 | ) | (19,981 | ) | 163,016 | (2,135,484 | ) | |||||||||
| Loss before income taxes | (3,502,387 | ) | (2,804,806 | ) | (7,068,623 | ) | (8,083,897 | ) | ||||||||
| Income tax expense | 231,610 | 10,460 | 388,520 | 45,090 | ||||||||||||
| Net loss | $ | (3,733,997 | ) | $ | (2,815,266 | ) | $ | (7,457,143 | ) | $ | (8,128,987 | ) | ||||
| Net loss per share - basic and diluted | $ | (0.15 | ) | $ | (0.11 | ) | $ | (0.30 | ) | $ | (0.35 | ) | ||||
| Weighted average number of common stock outstanding - basic and diluted | 25,041,733 | 24,544,334 | 24,971,056 | 23,354,036 | ||||||||||||
ASPEN GROUP, INC. AND SUBSIDIARIES
CONSOLIDATED STATEMENTS OF CHANGES IN STOCKHOLDERS’ EQUITY
Three Months Ended January 31, 2022 and 2021
(Unaudited)
| Common Stock | Additional Paid-In Capital | Treasury Stock | Accumulated Deficit | Total Stockholders’ Equity | ||||||||||||||||||||
| Shares | Amount | |||||||||||||||||||||||
| Balance at October 31, 2021 | 25,148,194 | $ | 25,149 | $ | 110,526,729 | $ | (1,817,414 | ) | $ | (61,881,149 | ) | $ | 46,853,315 | |||||||||||
| Stock-based compensation | — | — | 700,697 | — | — | 700,697 | ||||||||||||||||||
| Common stock issued for stock options exercised for cash | 41,667 | 41 | 134,959 | — | — | 135,000 | ||||||||||||||||||
| Common stock issued for vested restricted stock units | 38,719 | 39 | (39 | ) | — | — | — | |||||||||||||||||
| Amortization of warrant based cost | — | — | 16,125 | — | — | 16,125 | ||||||||||||||||||
| Net loss | — | — | — | — | (3,733,997 | ) | (3,733,997 | ) | ||||||||||||||||
| Balance at January 31, 2022 | 25,228,580 | $ | 25,229 | $ | 111,378,471 | $ | (1,817,414 | ) | $ | (65,615,146 | ) | $ | 43,971,140 | |||||||||||
| Common Stock | Additional Paid-In Capital | Treasury Stock | Accumulated Deficit | Total Stockholders’ Equity | ||||||||||||||||||||
| Shares | Amount | |||||||||||||||||||||||
| Balance at October 31, 2020 | 24,416,539 | $ | 24,417 | $ | 105,092,551 | $ | — | $ | (53,022,751 | ) | $ | 52,094,217 | ||||||||||||
| Stock-based compensation | — | — | 701,170 | — | — | 701,170 | ||||||||||||||||||
| Common stock issued for stock options exercised for cash | 447,134 | 447 | 2,180,352 | (1,817,414 | ) | — | 363,385 | |||||||||||||||||
| Common stock issued for vested restricted stock units | 74,000 | 74 | (74 | ) | — | — | — | |||||||||||||||||
| Common stock issued for services | 2,000 | 2 | 19,898 | — | — | 19,900 | ||||||||||||||||||
| Amortization of warrant based cost | — | — | 9,125 | — | — | 9,125 | ||||||||||||||||||
| Net loss | — | — | — | — | (2,815,266 | ) | (2,815,266 | ) | ||||||||||||||||
| Balance at January 31, 2021 | 24,939,673 | $ | 24,940 | $ | 108,003,022 | $ | (1,817,414 | ) | $ | (55,838,017 | ) | $ | 50,372,531 | |||||||||||
ASPEN GROUP, INC. AND SUBSIDIARIES
CONSOLIDATED STATEMENTS OF CHANGES IN STOCKHOLDERS’ EQUITY (CONTINUED)
Nine Months Ended January 31, 2022 and 2021
(Unaudited)
| Common Stock | Additional Paid-In Capital | Treasury Stock | Accumulated Deficit | Total Stockholders’ Equity | ||||||||||||||||||||
| Shares | Amount | |||||||||||||||||||||||
| Balance at April 30, 2021 | 25,066,297 | $ | 25,067 | $ | 109,040,824 | $ | (1,817,414 | ) | $ | (58,158,003 | ) | $ | 49,090,474 | |||||||||||
| Stock-based compensation | — | — | 1,965,567 | — | — | 1,965,567 | ||||||||||||||||||
| Common stock issued for stock options exercised for cash | 58,419 | 58 | 190,976 | — | — | 191,034 | ||||||||||||||||||
| Common stock issued for cashless stock options exercised | 30,156 | 30 | (30 | ) | — | — | — | |||||||||||||||||
| Common stock issued for vested restricted stock units | 73,708 | 74 | (74 | ) | — | — | — | |||||||||||||||||
| Amortization of warrant based cost | — | — | 43,708 | — | — | 43,708 | ||||||||||||||||||
| Warrants issued for deferred financing costs related to Credit Facility | — | — | 137,500 | — | — | 137,500 | ||||||||||||||||||
| Net loss | — | — | — | — | (7,457,143 | ) | (7,457,143 | ) | ||||||||||||||||
| Balance at January 31, 2022 | 25,228,580 | $ | 25,229 | $ | 111,378,471 | $ | (1,817,414 | ) | $ | (65,615,146 | ) | $ | 43,971,140 | |||||||||||
| Common Stock | Additional Paid-In Capital | Treasury Stock | Accumulated Deficit | Total Stockholders’ Equity | ||||||||||||||||||||
| Shares | Amount | |||||||||||||||||||||||
| Balance at April 30, 2020 | 21,770,520 | $ | 21,771 | $ | 89,505,216 | $ | (70,000 | ) | $ | (47,709,030 | ) | $ | 41,747,957 | |||||||||||
| Stock-based compensation | — | — | 3,019,828 | — | — | 3,019,828 | ||||||||||||||||||
| Common stock issued for stock options exercised for cash | 1,364,721 | 1,365 | 4,394,749 | (1,817,414 | ) | — | 2,578,700 | |||||||||||||||||
| Common stock issued for cashless stock options exercised | 22,339 | 22 | (22 | ) | — | — | — | |||||||||||||||||
| Common stock issued for conversion of Convertible Notes | 1,398,602 | 1,399 | 9,998,601 | — | — | 10,000,000 | ||||||||||||||||||
| Common stock issued for vested restricted stock units | 206,109 | 206 | (206 | ) | — | — | — | |||||||||||||||||
| Common stock issued for warrants exercised for cash | 192,049 | 192 | 1,081,600 | — | — | 1,081,792 | ||||||||||||||||||
| Common stock issued for services | 2,000 | 2 | 19,898 | — | — | 19,900 | ||||||||||||||||||
| Modification charge for warrants exercised | — | — | 25,966 | — | — | 25,966 | ||||||||||||||||||
| Amortization of warrant based cost | — | — | 27,375 | — | — | 27,375 | ||||||||||||||||||
| Cancellation of Treasury Stock | (16,667 | ) | (17 | ) | (69,983 | ) | 70,000 | — | — | |||||||||||||||
| Net loss | — | — | — | — | (8,128,987 | ) | (8,128,987 | ) | ||||||||||||||||
| Balance at January 31, 2021 | 24,939,673 | $ | 24,940 | $ | 108,003,022 | $ | (1,817,414 | ) | $ | (55,838,017 | ) | $ | 50,372,531 | |||||||||||
ASPEN GROUP, INC. AND SUBSIDIARIES
CONSOLIDATED STATEMENTS OF CASH FLOWS
(Unaudited)
| Nine Months Ended January 31, | ||||||||
| 2022 | 2021 | |||||||
| Cash flows from operating activities: | ||||||||
| Net loss | $ | (7,457,143 | ) | $ | (8,128,987 | ) | ||
| Adjustments to reconcile net loss to net cash used in operating activities: | ||||||||
| Bad debt expense | 1,050,000 | 1,702,000 | ||||||
| Depreciation and amortization | 2,480,179 | 1,552,254 | ||||||
| Stock-based compensation | 1,965,567 | 3,019,828 | ||||||
| Amortization of warrant based cost | 43,708 | 27,375 | ||||||
| Amortization of debt discounts | — | 1,550,854 | ||||||
| Amortization of debt issue costs | 18,056 | 156,029 | ||||||
| Amortization of deferred financing costs | 49,107 | — | ||||||
| Modification charge for warrants exercised | — | 25,966 | ||||||
| Loss on asset disposition | 36,445 | — | ||||||
| Lease benefit | (96,450 | ) | — | |||||
| Tenant improvement allowances received from landlords | 816,591 | — | ||||||
| Common stock issued for services | — | 19,900 | ||||||
| Changes in operating assets and liabilities: | ||||||||
| Accounts receivable | (6,412,590 | ) | (6,493,238 | ) | ||||
| Prepaid expenses | (297,797 | ) | (267,526 | ) | ||||
| Other receivables | — | 23,097 | ||||||
| Other current assets | 37,498 | (1,205,083 | ) | |||||
| Accounts receivable, other | 45,329 | — | ||||||
| Deposits and other assets | (44,686 | ) | (185,599 | ) | ||||
| Accounts payable | 340,168 | (349,882 | ) | |||||
| Accrued expenses | 38,353 | 1,756,102 | ||||||
| Due to students | 482,032 | (128,154 | ) | |||||
| Deferred revenue | (642,233 | ) | 1,887,377 | |||||
| Other current liabilities | (171,894 | ) | (238,032 | ) | ||||
| Net cash used in operating activities | (7,719,760 | ) | (5,275,719 | ) | ||||
| Cash flows from investing activities: | ||||||||
| Purchases of courseware and accreditation | (161,262 | ) | (31,330 | ) | ||||
| Purchases of property and equipment | (3,573,408 | ) | (2,877,758 | ) | ||||
| Net cash used in investing activities | (3,734,670 | ) | (2,909,088 | ) | ||||
| Cash flows from financing activities: | ||||||||
| Borrowings under the Credit Facility | 5,000,000 | — | ||||||
| Proceeds from stock options exercised | 191,034 | 2,578,700 | ||||||
| Proceeds from warrants exercised | — | 1,081,792 | ||||||
| Net cash provided by financing activities | 5,191,034 | 3,660,492 | ||||||
(Continued)
ASPEN GROUP, INC. AND SUBSIDIARIES
CONSOLIDATED STATEMENTS OF CASH FLOWS (CONTINUED)
(Unaudited)
| Nine Months Ended January 31, | ||||||||
| 2022 | 2021 | |||||||
| Net decrease in cash, cash equivalents and restricted cash | $ | (6,263,396 | ) | $ | (4,524,315 | ) | ||
| Cash, cash equivalents and restricted cash at beginning of period | 13,666,079 | 17,906,765 | ||||||
| Cash, cash equivalents and restricted cash at end of period | $ | 7,402,683 | $ | 13,382,450 | ||||
| Supplemental disclosure cash flow information: | ||||||||
| Cash paid for interest | $ | 258,630 | $ | 310,958 | ||||
| Cash paid for income taxes | $ | 13,520 | $ | 49,008 | ||||
| Supplemental disclosure of non-cash investing and financing activities: | ||||||||
| Common stock issued for conversion of Convertible Notes | $ | — | $ | 10,000,000 | ||||
| Warrants issued as part of Credit Facility | $ | 137,500 | $ | — | ||||
The following table provides a reconciliation of cash and cash equivalents and restricted cash reported within the accompanying consolidated balance sheet to the total amounts shown in the accompanying unaudited consolidated statements of cash flows:
| January 31, 2022 | April 30, 2021 | |||||||
| Cash and cash equivalents | $ | 5,969,286 | $ | 12,472,082 | ||||
| Restricted cash | 1,433,397 | 1,193,997 | ||||||
| Total cash, cash equivalents and restricted cash | $ | 7,402,683 | $ | 13,666,079 | ||||