
August, 2018Nasdaq: ASPU 1
2 Safe Harbor Statement Certain statements in this presentation and responses to various questions include forward-looking statements within the meaning of the Private Securities Litigation Reform Act of 1995, including statements regarding USU’s future role with family nurse practitioner’s, projected gross margins, assumptions regarding LTV, and our low customer acquisition costs and teaching costs creating favorable gross margins, and our projected annual revenue rate per campus. The words “believe,” “may,” “estimate,” “continue,” “anticipate,” “intend,” “should,” “plan,” “could,” “target,” “potential,” “is likely,” “will,” “expect” and similar expressions, as they relate to us, are intended to identify forward-looking statements. We have based these forward-looking statements largely on our current expectations and projections about future events and financial trends that we believe may affect our financial condition, results of operations, business strategy and financial needs. Important factors that could cause actual results to differ from those in the forward-looking statements include the continued effectiveness of our online marketing, the ability to hold academic teaching costs in line, how students react to our hybrid pre-licensure BSN program over time, and the Company’s ability to enter into partnerships with health care organizations to establish new campuses and/or finance those campuses. Further information on our risk factors is contained in our filings with the SEC, including the 10-K dated July 13, 2018. Any forward-looking statement made by us herein speaks only as of the date on which it is made. Factors or events that could cause our actual results to differ may emerge from time to time, and it is not possible for us to predict all of them. We undertake no obligation to publicly update any forward-looking statement, whether as a result of new information, future developments or otherwise, except as may be required by law. Regulation G - Non-GAAP Financial Measures This presentation includes a discussion of Adjusted EBITDA, Adjusted Net Loss Per Share and Adjusted Gross Margins, non-GAAP financial measures. Certaininformation regarding these non-GAAP financial measures (including reconciliations to GAAP)is provided on the Investor Relations section of the Aspen website at www.ir.aspen.edu.
3 Aspen Group Vision “To Make College Affordable Again”
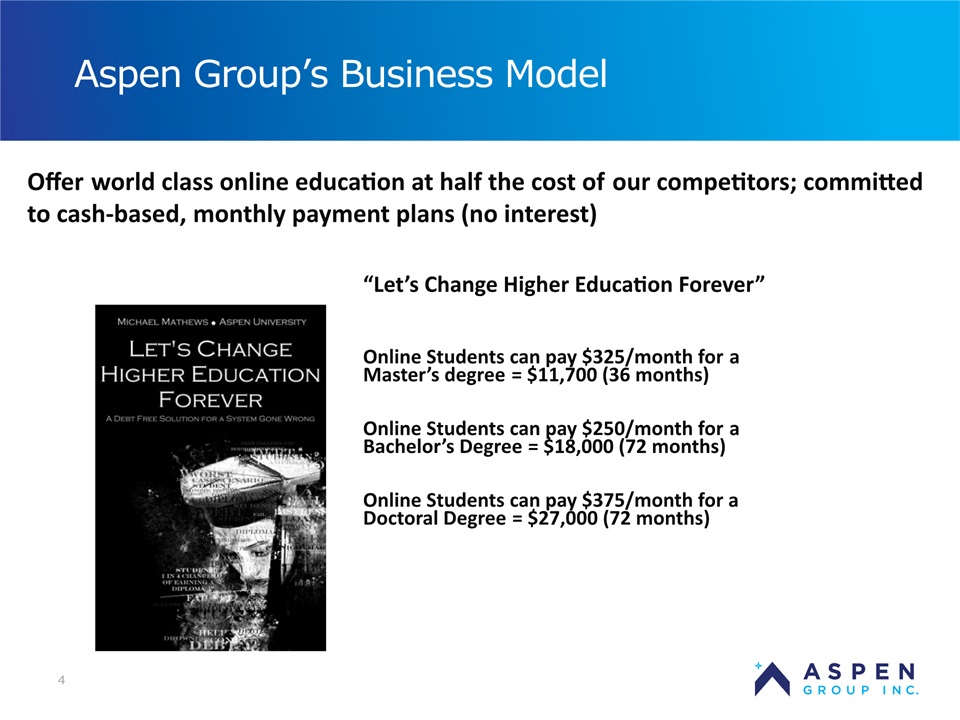
4 Aspen Group’s Business Model Offer world class online education at half the cost of our competitors; committed to cash-based, monthly payment plans (no interest) “Let’s Change Higher Education Forever” Online Students can pay $325/month for a Master’s degree = $11,700 (36 months) Online Students can pay $250/month for a Bachelor’s Degree = $18,000 (72 months) Online Students can pay $375/month for a Doctoral Degree = $27,000 (72 months)
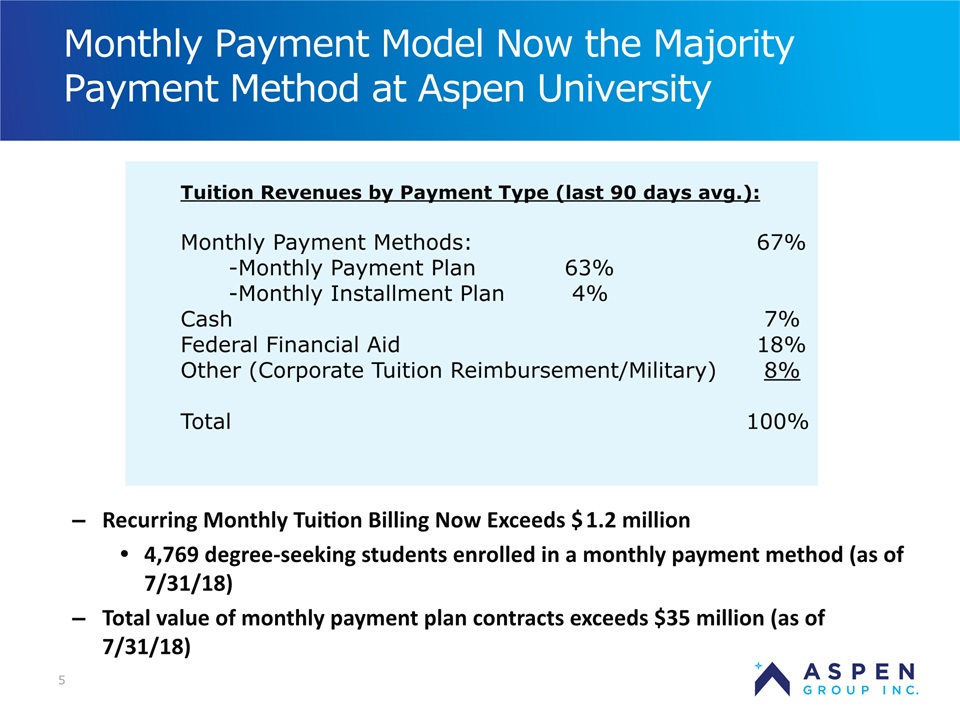
5 Monthly Payment Model Now the Majority Payment Method at Aspen University Recurring Monthly Tuition Billing Now Exceeds $1.2 million4,769 degree-seeking students enrolled in a monthly payment method (as of 7/31/18)Total value of monthly payment plan contracts exceeds $35 million (as of 7/31/18) Tuition Revenues by Payment Type (last 90 days avg.): Monthly Payment Methods: 67% -Monthly Payment Plan 63% -Monthly Installment Plan 4%Cash 7%Federal Financial Aid 18%Other (Corporate Tuition Reimbursement/Military) 8%Total 100%
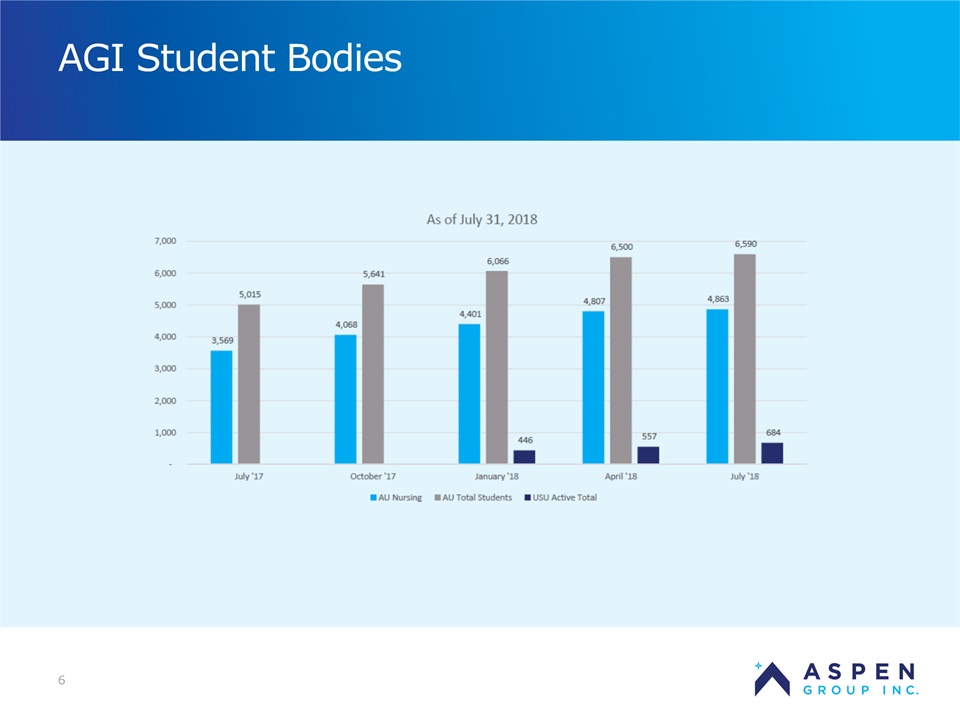
AGI Student Bodies 6
7 Targeting Four Growth Vectors
8 Growth Vector 1: RNs - Fully OnlineRN to BSN & MSN RNs (post-licensure):BSN & MSN2.9mm RNs in U.S. Today65,000 Starts per Annum(TAM: - $478mm)**Assumes Aspen’s $7,350 LTV
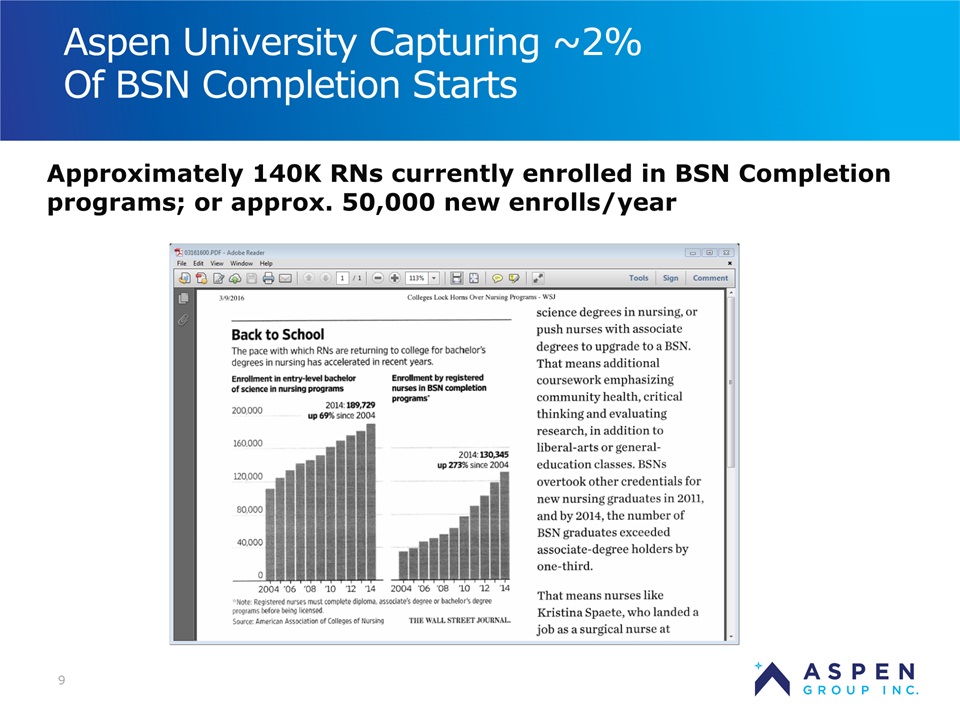
9 Aspen University Capturing ~2%Of BSN Completion Starts Approximately 140K RNs currently enrolled in BSN Completion programs; or approx. 50,000 new enrolls/year
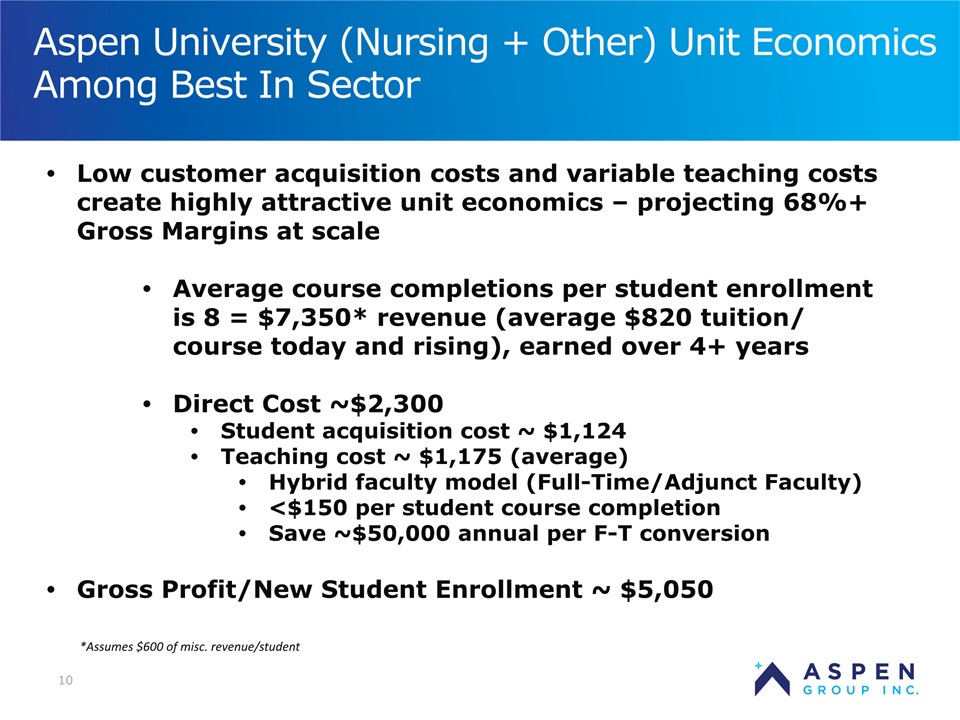
10 Aspen University (Nursing + Other) Unit Economics Among Best In Sector Low customer acquisition costs and variable teaching costs create highly attractive unit economics – projecting 68%+ Gross Margins at scaleAverage course completions per student enrollment is 8 = $7,350* revenue (average $820 tuition/ course today and rising), earned over 4+ yearsDirect Cost ~$2,300Student acquisition cost ~ $1,124Teaching cost ~ $1,175 (average)Hybrid faculty model (Full-Time/Adjunct Faculty)<$150 per student course completionSave ~$50,000 annual per F-T conversionGross Profit/New Student Enrollment ~ $5,050 *Assumes $600 of misc. revenue/student
10 Aspen University (Nursing + Other) Unit Economics Among Best In Sector Low customer acquisition costs and variable teaching costs create highly attractive unit economics – projecting 68%+ Gross Margins at scaleAverage course completions per student enrollment is 8 = $7,350* revenue (average $820 tuition/ course today and rising), earned over 4+ yearsDirect Cost ~$2,300Student acquisition cost ~ $1,124Teaching cost ~ $1,175 (average)Hybrid faculty model (Full-Time/Adjunct Faculty)<$150 per student course completionSave ~$50,000 annual per F-T conversionGross Profit/New Student Enrollment ~ $5,050 *Assumes $600 of misc. revenue/student
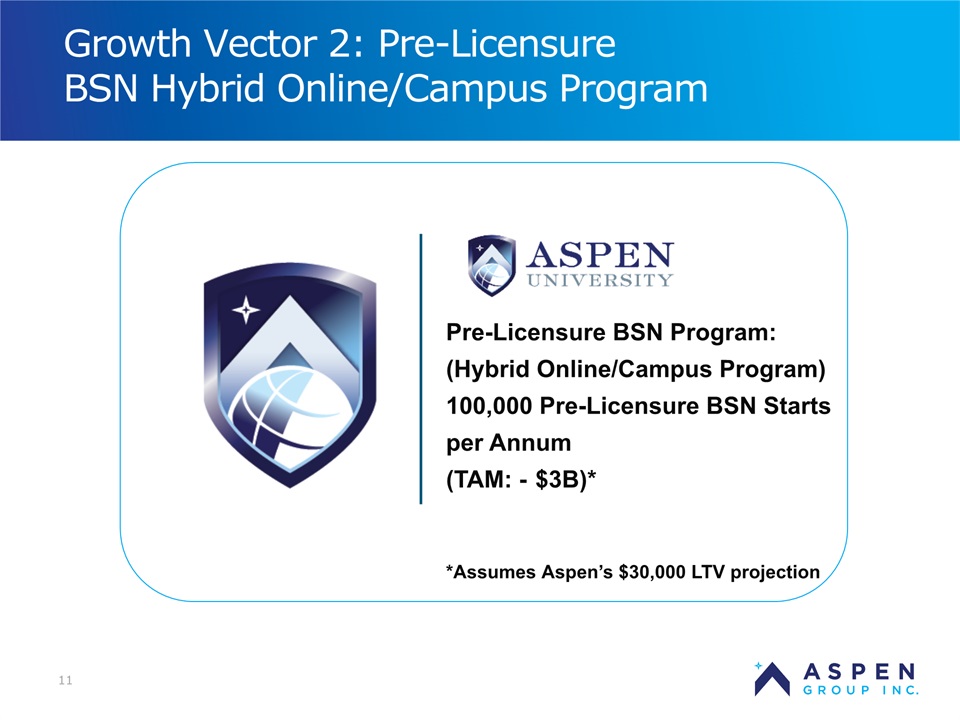
11 Growth Vector 2: Pre-Licensure BSN Hybrid Online/Campus Program Pre-Licensure BSN Program:(Hybrid Online/Campus Program)100,000 Pre-Licensure BSN Startsper Annum(TAM: - $3B)**Assumes Aspen’s $30,000 LTV projection
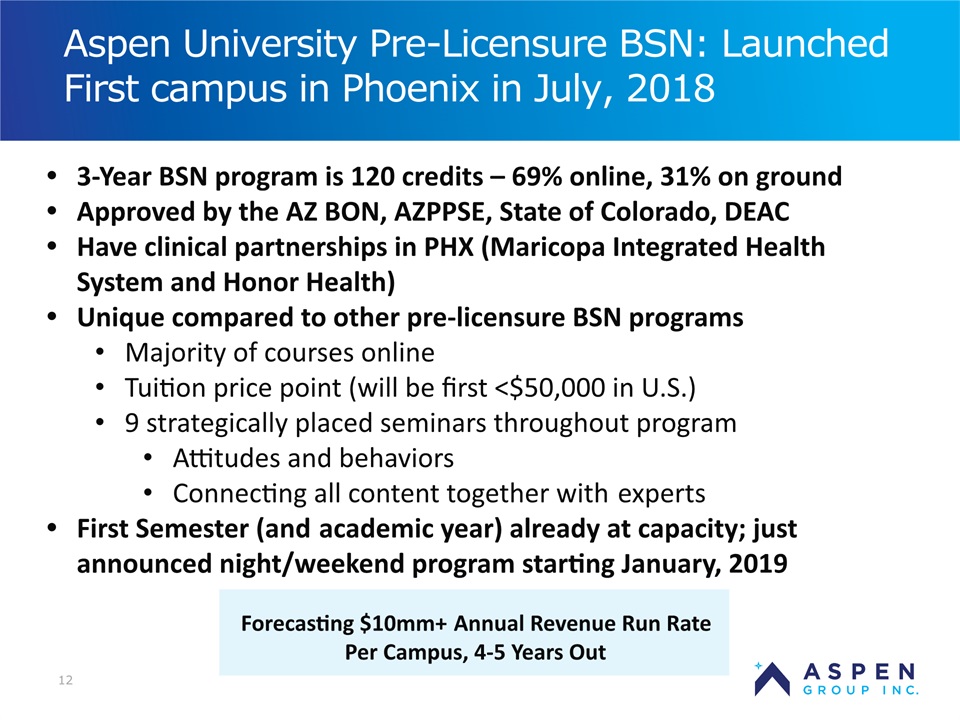
12 Aspen University Pre-Licensure BSN: LaunchedFirst campus in Phoenix in July, 2018 3-Year BSN program is 120 credits – 69% online, 31% on groundApproved by the AZ BON, AZPPSE, State of Colorado, DEACHave clinical partnerships in PHX (Maricopa Integrated Health System and Honor Health)Unique compared to other pre-licensure BSN programsMajority of courses onlineTuition price point (will be first <$50,000 in U.S.)9 strategically placed seminars throughout programAttitudes and behaviorsConnecting all content together with expertsFirst Semester (and academic year) already at capacity; just announced night/weekend program starting January, 2019 Forecasting $10mm+ Annual Revenue Run Rate Per Campus, 4-5 Years Out
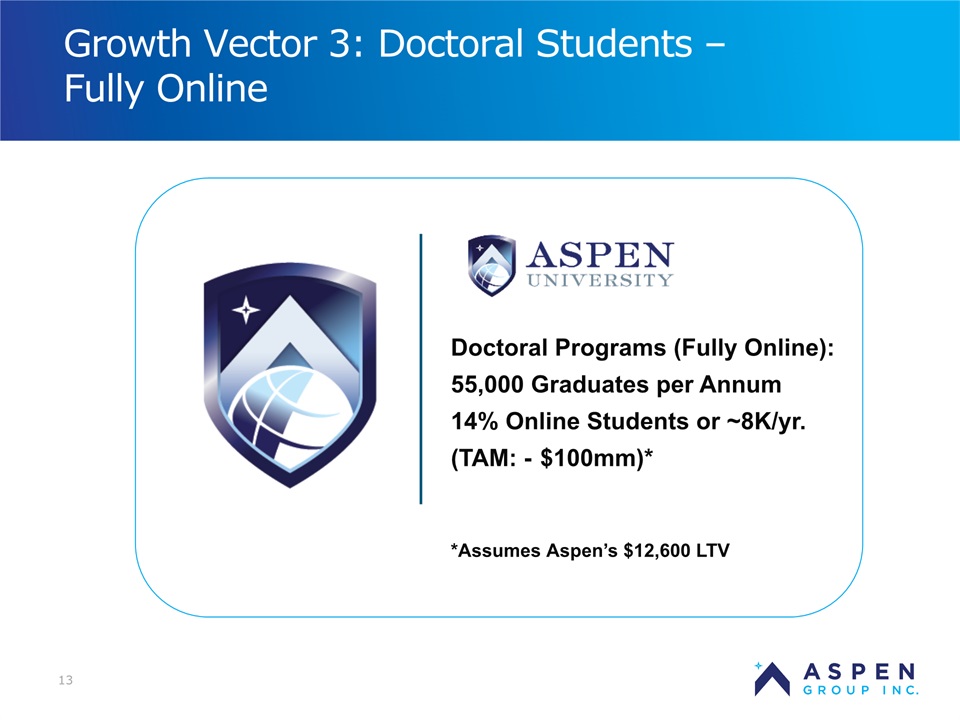
13 Growth Vector 3: Doctoral Students – Fully Online Doctoral Programs (Fully Online):55,000 Graduates per Annum14% Online Students or ~8K/yr.(TAM: - $100mm)**Assumes Aspen’s $12,600 LTV
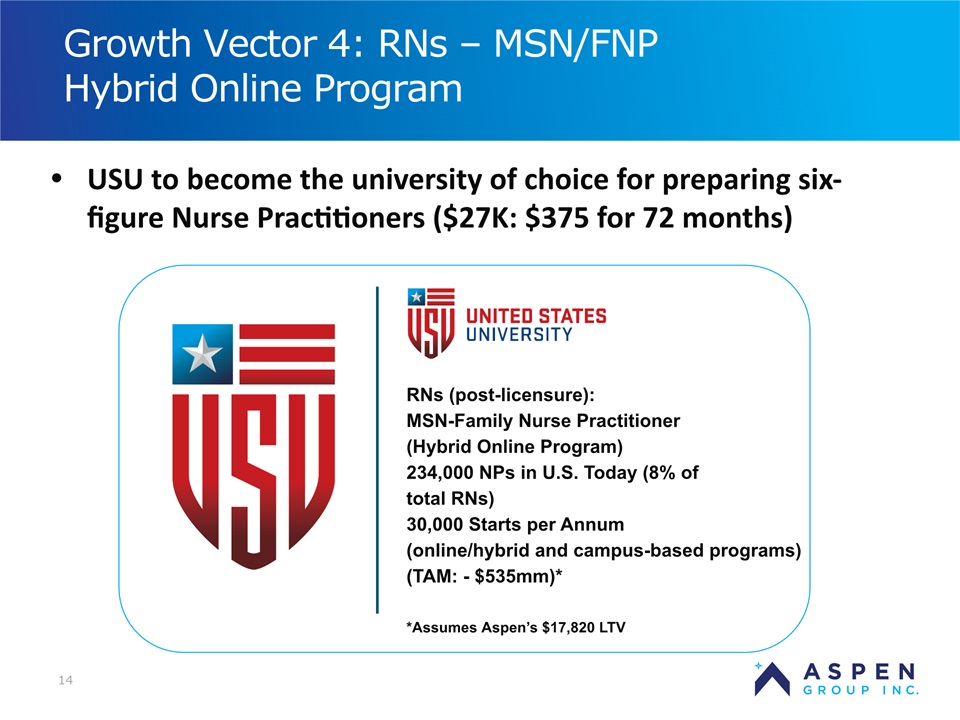
14 Growth Vector 4: RNs – MSN/FNP Hybrid Online Program USU to become the university of choice for preparing six-figure Nurse Practitioners ($27K: $375 for 72 months) RNs (post-licensure):MSN-Family Nurse Practitioner (Hybrid Online Program)234,000 NPs in U.S. Today (8% oftotal RNs)30,000 Starts per Annum (online/hybrid and campus-based programs) (TAM: - $535mm)**Assumes Aspen’s $17,820 LTV
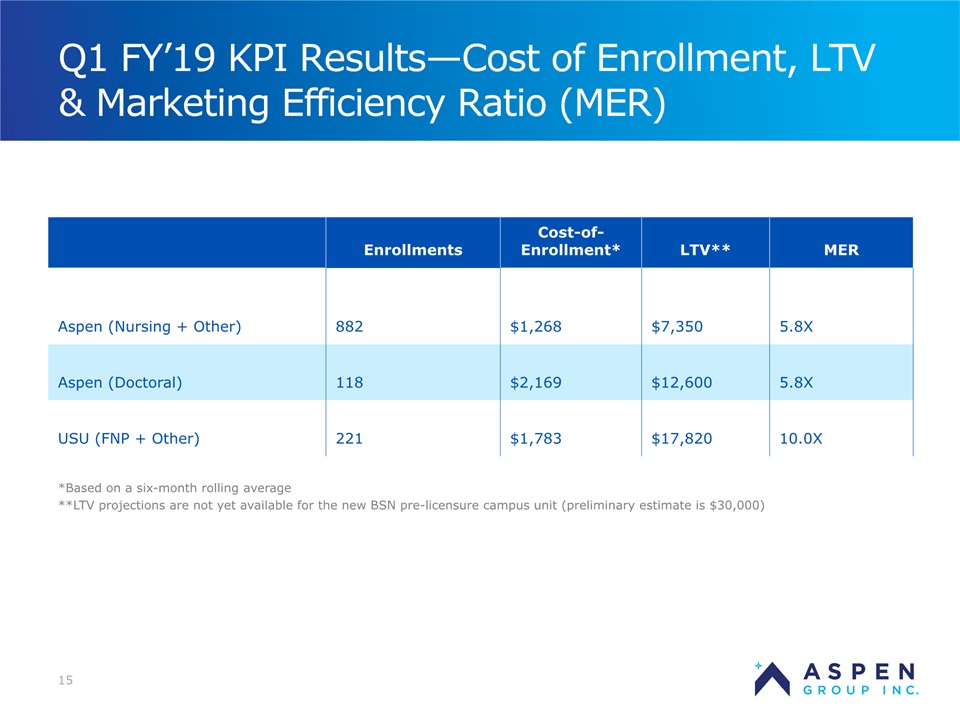
Q1 FY’19 KPI Results—Cost of Enrollment, LTV & Marketing Efficiency Ratio (MER) 15 *Based on a six-month rolling average**LTV projections are not yet available for the new BSN pre-licensure campus unit (preliminary estimate is $30,000) Enrollments Cost-of-Enrollment* LTV** MER Aspen (Nursing + Other) 882 $1,268 $7,350 5.8X Aspen (Doctoral) 118 $2,169 $12,600 5.8X USU (FNP + Other) 221 $1,783 $17,820 10.0X
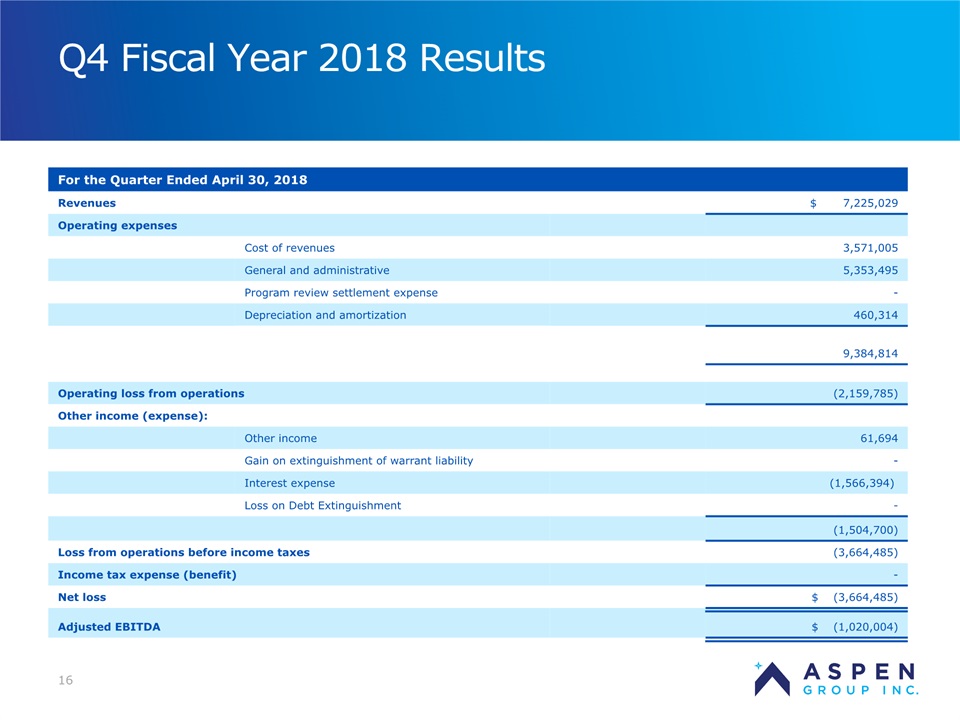
Q4 Fiscal Year 2018 Results 16 For the Quarter Ended April 30, 2018 Revenues $ 7,225,029 Operating expenses Cost of revenues 3,571,005 General and administrative 5,353,495 Program review settlement expense - Depreciation and amortization 460,314 9,384,814 Operating loss from operations (2,159,785) Other income (expense): Other income 61,694 Gain on extinguishment of warrant liability - Interest expense (1,566,394) Loss on Debt Extinguishment - (1,504,700) Loss from operations before income taxes (3,664,485) Income tax expense (benefit) - Net loss $ (3,664,485) Adjusted EBITDA $ (1,020,004)
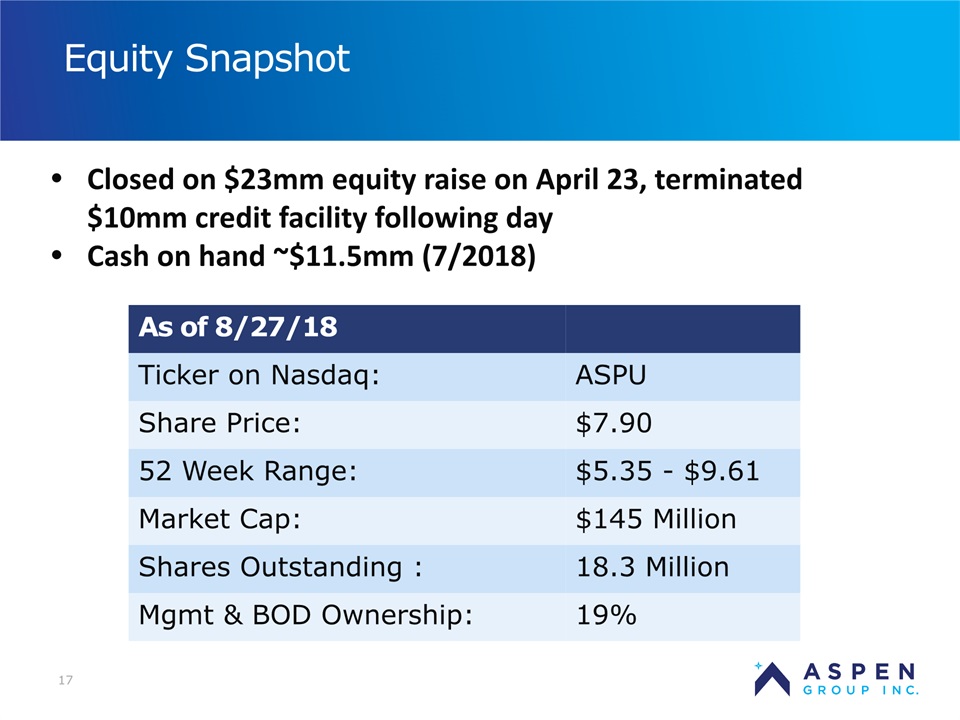
17 Equity Snapshot Closed on $23mm equity raise on April 23, terminated $10mm credit facility following day Cash on hand ~$11.5mm (7/2018) As of 8/27/18 Ticker on Nasdaq: ASPU Share Price: $7.90 52 Week Range: $5.35 - $9.61 Market Cap: $145 Million Shares Outstanding : 18.3 Million Mgmt & BOD Ownership: 19%

KPI Results 18
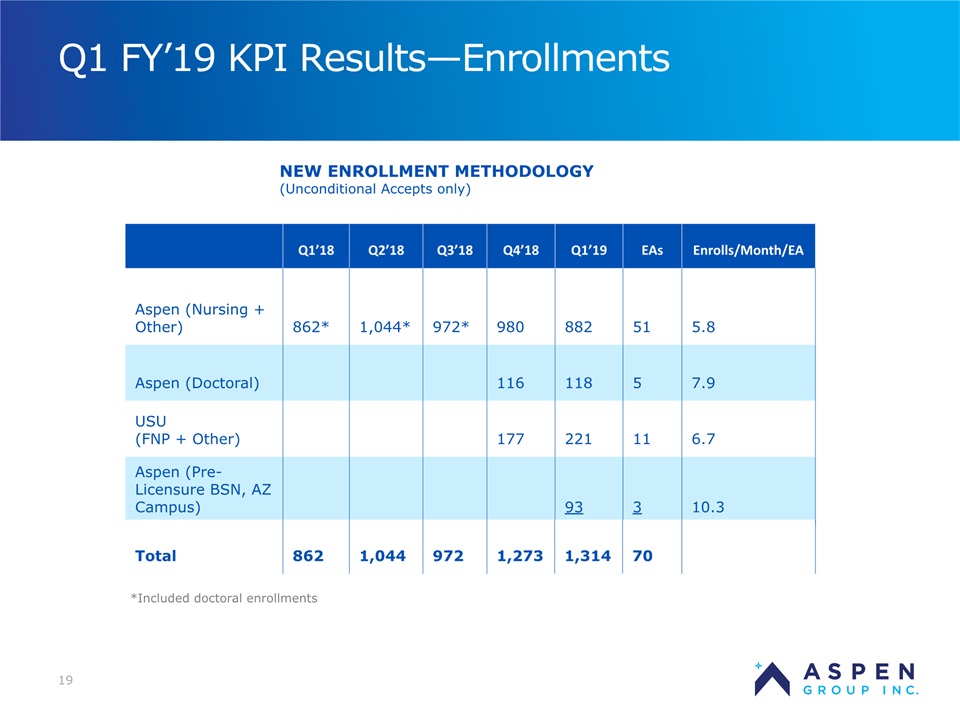
Q1 FY’19 KPI Results—Enrollments 19 *Included doctoral enrollments Q1’18 Q2’18 Q3’18 Q4’18 Q1’19 EAs Enrolls/Month/EA Aspen (Nursing + Other) 862* 1,044* 972* 980 882 51 5.8 Aspen (Doctoral) 116 118 5 7.9 USU (FNP + Other) 177 221 11 6.7 Aspen (Pre-Licensure BSN, AZ Campus) 93 3 10.3 NEW ENROLLMENT METHODOLOGY (Unconditional Accepts only) Total 862 1,044 972 1,273 1,314 70
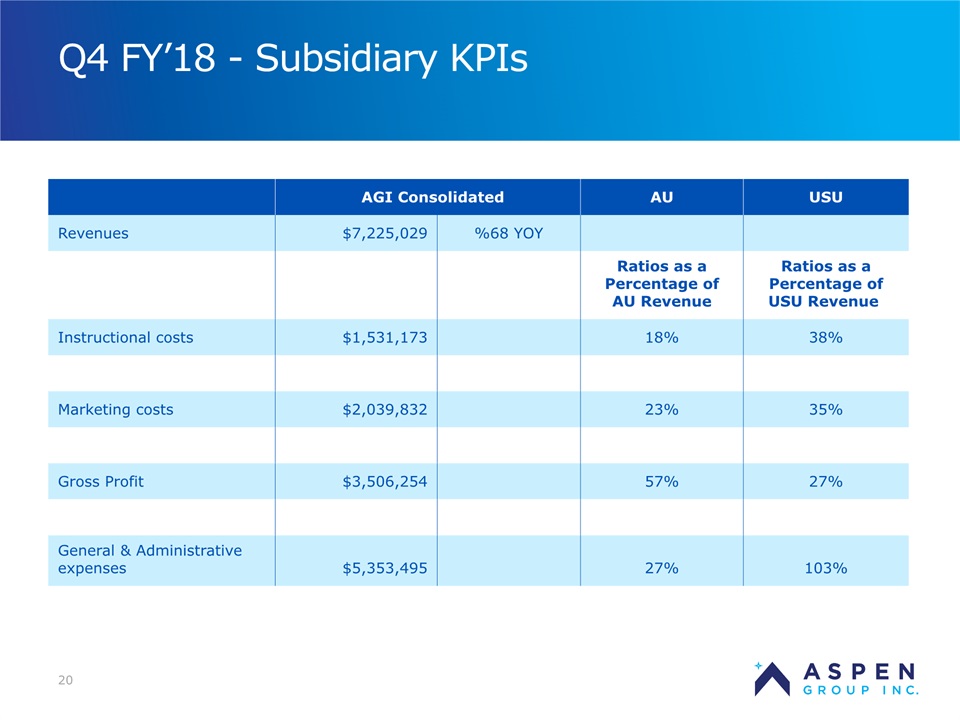
Q4 FY’18 - Subsidiary KPIs 20 AGI Consolidated AU USU Revenues $7,225,029 68% YOY Ratios as a Percentage of AU Revenue Ratios as a Percentage of USU Revenue Instructional costs $1,531,173 18% 38% Marketing costs $2,039,832 23% 35% Gross Profit $3,506,254 57% 27% General & Administrative expenses $5,353,495 27% 103%
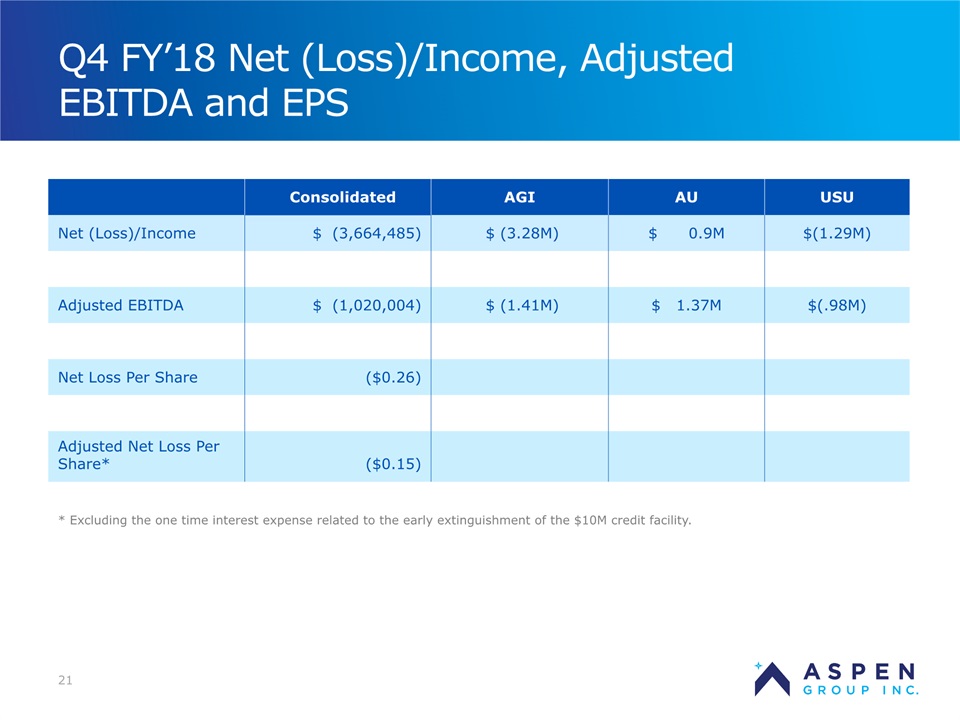
Q4 FY’18 Net (Loss)/Income, Adjusted EBITDA and EPS 21 Consolidated AGI AU USU Net (Loss)/Income $ (3,664,485) $ (3.28M) $ 0.9M $(1.29M) Adjusted EBITDA $ (1,020,004) $ (1.41M) $ 1.37M $(.98M) Net Loss Per Share ($0.26) Adjusted Net Loss Per Share* ($0.15) * Excluding the one time interest expense related to the early extinguishment of the $10M credit facility.
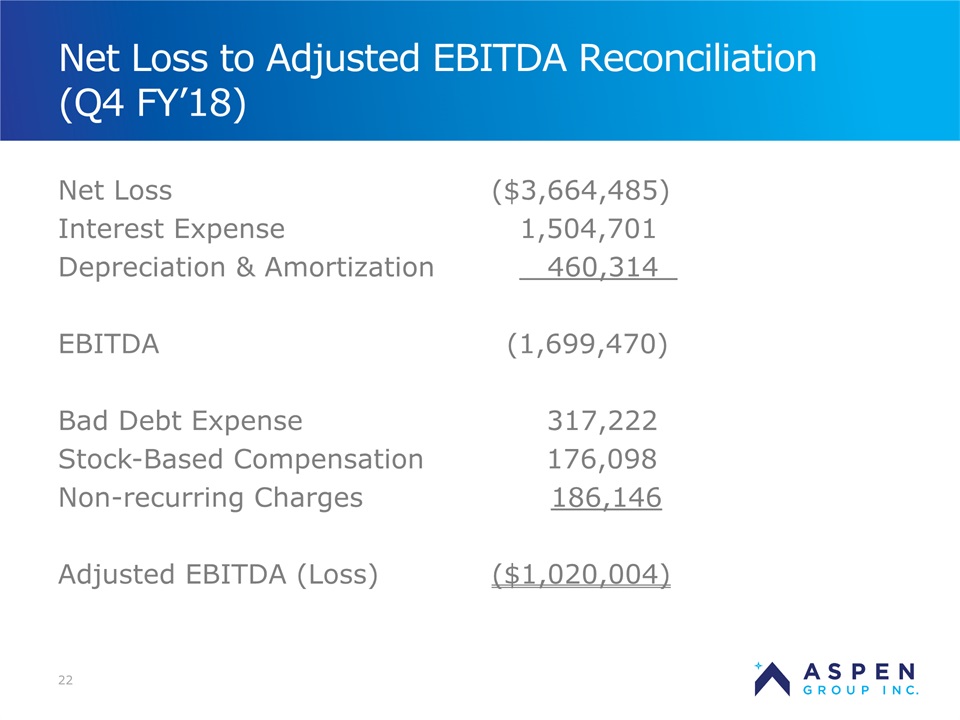
Net Loss to Adjusted EBITDA Reconciliation(Q4 FY’18) Net Loss ($3,664,485)Interest Expense 1,504,701 Depreciation & Amortization 460,314 EBITDA (1,699,470) Bad Debt Expense 317,222Stock-Based Compensation 176,098Non-recurring Charges 186,146Adjusted EBITDA (Loss) ($1,020,004) 22