Aspen Group Reports Revenue of $18.9 million, or 12% Growth, for Second Quarter Fiscal 2022
- Revenue increased to $18.9 million compared to $17.0 million last year
- Business units with highest LTV degrees accounted for 54% of revenue
-
Net loss of ($2.9) million, an improvement of $1.5 million year-over-year
NEW YORK, Dec. 14, 2021 (GLOBE NEWSWIRE) -- Aspen Group, Inc. (Nasdaq: ASPU) (“AGI”), an education technology holding company, today announced financial results for its second quarter fiscal year 2022 ended October 31, 2021.
Second Quarter Fiscal Year 2022 Summary Results
| Three Months Ended October 31, | Six Months Ended October 31, | ||||||||||||||
| 2021 | 2020 | 2021 | 2020 | ||||||||||||
| $ in millions, except per share data | |||||||||||||||
| Revenue | $ | 18.9 | $ | 17.0 | $ | 38.4 | $ | 32.1 | |||||||
| Gross Profit1 | $ | 9.7 | $ | 9.3 | $ | 20.1 | $ | 18.3 | |||||||
| Gross Margin (%)1 | 51 | % | 55 | % | 52 | % | 57 | % | |||||||
| Net Income (Loss) | $ | (2.9 | ) | $ | (4.4 | ) | $ | (3.7 | ) | $ | (5.3 | ) | |||
| Earnings (Loss) per Share | $ | (0.11 | ) | $ | (0.19 | ) | $ | (0.15 | ) | $ | (0.23 | ) | |||
| EBITDA2 | $ | (1.9 | ) | $ | (2.3 | ) | $ | (1.8 | ) | $ | (2.3 | ) | |||
| Adjusted EBITDA2 | $ | (0.7 | ) | $ | 0.2 | $ | (0.2 | ) | $ | 1.5 | |||||
_______________________
1 GAAP gross profit calculation includes marketing and promotional costs, instructional costs and services, and amortization expense of $0.5 million and $0.9 million, and $0.4 million and $0.7 million, for the three and six months ended October 31, 2021 and 2020, respectively.
2 Non-GAAP financial measure. See reconciliations of GAAP to non-GAAP financial measures under "Non-GAAP–Financial Measures" starting on page 5.
“In the second quarter, our high-LTV degree programs increased to 54% of total revenue fueled by continued strong growth in our BSN Pre-Licensure and MSN Family Nurse Practitioner (FNP) programs, which combined with careful management of our costs, reduced our net loss by 35% year-over-year,” said Michael Mathews, Chairman and CEO of AGI. “Beginning in the second half of June, the rapid rise in COVID hospitalizations increased the workload of licensed registered nurses (RNs) on the front lines of patient care. RNs represented 69% of our total active student body at the end of the second quarter of fiscal year 2022 and are the total population of our students primarily impacted by the COVID pandemic trends. As a result, our pace of enrollments and class starts slowed in the second quarter, similar to the effect seen across the entire nursing higher education sector during the same period.”
“Two primary dynamics in the nursing sector favor the Aspen Group business model,” continued Mr. Mathews. “First, the ongoing nursing shortage provides a strong backdrop for the continued expansion of our high-LTV BSN Pre-Licensure nursing program. Second, RNs interested in moving to private clinics and the growing awareness within health care organizations of the economic benefits of hiring FNPs will be drivers for continued growth in our FNP degree program. When the COVID headwinds diminish, we anticipate that Aspen Group’s revenue growth will accelerate, supported by our BSN Pre-Licensure expansion which has been relatively unaffected by COVID to date.”
COVID-19 Update
Nursing students represented 87% or 12,442 of the Company’s total student body of 14,318 students at the end of the second quarter of fiscal 2022. Of the 12,442 nursing students, 2,500 are BSN Pre-Licensure students located across our four metro locations (Phoenix, Austin, Tampa, and Nashville). The remaining 9,942 nursing students are RNs studying to earn an advanced degree (RN to BSN, MSN, MSN-FNP, or DNP degree programs). Therefore, these 9,942 post-licensure nursing students represent 69% of the Company’s total student body and are the population of AGI students primarily affected by the COVID-19 pandemic.
Starting in the second half of June 2021 and continuing through October 2021, the Company saw lower course starts than seasonally expected among our RN student body. For example, at Aspen University, course starts among RNs from June through October increased by approximately 3% year-over-year. By comparison, over the previous two full fiscal years (Fiscal year 2021 and Fiscal 2020), course starts among RNs at Aspen University increased by an average of approximately 10% year-over-year.
In terms of new student enrollments, the Company saw enrollment growth on a quarterly sequential basis in all BSN Pre-Licensure metros as these prospective students continue to communicate a strong desire to enter the nursing profession. However, aggregate enrollments among RNs at both Aspen University and United States University were relatively flat on a quarterly sequential basis.
We cannot be certain what impact the Delta variant and other variants will have on the Company’s results as we progress through the second half of fiscal 2022.
Outlook for Fiscal Year 2022
The Company anticipates continued growth in USU's MSN-FNP program and AU’s BSN Pre-Licensure program as we execute our strategy to expand our two highest LTV programs for the remainder of fiscal year 2022. While the COVID-19 pandemic may continue to impact post-licensure revenue growth, the Company intends to prudently manage discretionary G&A spending in the coming months to minimize the impact of any revenue shortfalls. However, we will not eliminate spending critical to the execution of the Company’s long-term strategy.
Though we cannot be certain how the pandemic will continue to unfold, we have seen our class starts and enrollments in post-licensure programs impacted by COVID during the first two quarters of fiscal year 2022. Given the difficulty in foreseeing when this external headwind will diminish, we are revising our guidance for the remainder of fiscal year 2022, as indicated in the table below.
| Dollar amounts in millions, except per share data | Prior Guidance Range | Revised Guidance Range | |||||||||||||
| Revenue | $ | 85.0 | $ | 88.0 | $ | 77.0 | $ | 80.0 | |||||||
| Net Income (Loss) 1 | $ | (4.5 | ) | $ | (3.0 | ) | $ | (9.0 | ) | $ | (7.0 | ) | |||
| GAAP Earnings (Loss) per Share1 | $ | (0.18 | ) | $ | (0.12 | ) | $ | (0.38 | ) | $ | (0.29 | ) | |||
| EBITDA1 | $ | (1.6 | ) | $ | 0.4 | $ | (5.0 | ) | $ | (3.0 | ) | ||||
| Adjusted EBITDA1 | $ | 2.0 | $ | 4.0 | $ | (2.0 | ) | $ | 0.0 | ||||||
1 Non-GAAP financial measure. See reconciliations of GAAP to Non-GAAP financial measures under "Non-GAAP–Financial Measures" starting on page 5.
Fiscal Q2 2022 Financial and Operational Results (compared to Fiscal Q2 2021)
Revenue increased to $18.9 million for Fiscal Q2 2022 compared to $17.0 million for Fiscal Q2 2021. United States University (USU) revenue for the quarter, which includes the high LTV MSN-FNP program, accounted for 33%, or $6.2 million versus 29%, or $4.9 million of consolidated revenue in the prior year period. Aspen University’s (AU) revenue in the second quarter of fiscal year 2022, which includes the high LTV BSN Pre-Licensure program, accounted for 67%, or $12.8 million, versus 71% or $12.1 million of consolidated revenue in the prior year period.
GAAP gross profit increased 4% to $9.7 million for Fiscal Q2 2022 compared to $9.3 million for Fiscal Q2 2021. Gross margin was 51% for Fiscal Q2 2022 compared to 55% for Fiscal Q2 2021. Gross margin in Fiscal Q2 2022 was impacted by higher instructional costs related to the BSN Pre-Licensure program. AU gross margin was 50% of AU revenue for Fiscal Q2 2022 versus 56% in Fiscal Q2 2021, and USU gross margin was 58% of USU revenue for Fiscal Q2 2022 versus 56% in Fiscal Q2 2021.
Net loss and net loss per share were ($2.9) million and ($0.11), respectively, for Fiscal Q2 2022 compared to ($4.4) million and ($0.19), respectively, for Fiscal Q2 2021. AU generated net income of $1.3 million for Fiscal Q2 2022 versus $2.2 million in Fiscal Q2 2021, and USU generated net income of $0.9 million for Fiscal Q2 2022 versus $0.6 million in Fiscal Q2 2021. AGI corporate incurred a net loss of ($5.1) million for Fiscal Q2 2022 as compared to ($7.1) million in the prior year period.
EBITDA was ($1.9) million and (10%) margin for Fiscal Q2 2022 compared to EBITDA of ($2.3) million and (13%) margin for Fiscal Q2 2021.
For Fiscal Q2 2022, AU generated EBITDA of $2.0 million and 16% margin as compared to $2.7 million or 23% margin in Fiscal Q2 2021. USU generated EBITDA of $1.0 million and 16% margin, as compared to $0.6 million or 12% margin in Fiscal Q2 2021. AGI corporate incurred EBITDA of ($4.9) million as compared to ($5.6) million in Fiscal Q2 2021.
Adjusted EBITDA was ($0.7) million and (4%) margin for Fiscal Q2 2022 compared to Adjusted EBITDA of $0.2 million and 1% margin for Fiscal Q2 2021.
For Fiscal Q2 2022, AU generated Adjusted EBITDA of $2.3 million and 18% margin, as compared to $3.4 million or 28% margin in Fiscal Q2 2021. USU generated Adjusted EBITDA of $1.1 million and 18% margin, as compared to $0.7 million or 14% margin in Fiscal Q2 2021. AGI corporate incurred Adjusted EBITDA of ($4.1) million as compared to ($3.9) million in Fiscal Q2 2021.
Operating Metrics
New student enrollments at AU grew sequentially by 9% primarily as a result of rising enrollments in the three new pre-licensure metros (Austin, Nashville and Tampa). AU year-over-year new enrollments were down 13% as a result of the planned reduction of BSN Pre-Licensure enrollments in the Phoenix metro year-over-year and the impact of COVID-19 (specifically the effect the Delta variant surge has had among prospective RN students starting in June 2021). New student enrollments at USU decreased by 7% sequentially and 3% year-over-year, from 649 a year ago to 630. New RN student enrollments at USU were similarly impacted by COVID-19.
On a Company-wide basis, new student enrollments increased sequentially from 2,276 to 2,380 or 5%, primarily as a result of sequential enrollment growth in the three new pre-licensure metros. On a year-over-year basis, new student enrollments for the Company were down 10% due to the planned enrollment reduction in the Phoenix pre-licensure metro and the COVID-19 impact.
New student enrollments for the past five quarters are shown below:
| New Student Quarterly Enrollments | ||||||||||||||
| Q2'21 | Q3'21 | Q4'21 | Q1'22 | Q2'22 | ||||||||||
| Aspen University | 2,010 | 1,593 | 1,593 | 1,601 | 1,750 | |||||||||
| USU | 649 | 536 | 589 | 675 | 630 | |||||||||
| Total | 2,659 | 2,129 | 2,182 | 2,276 | 2,380 | |||||||||
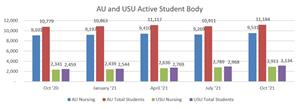
AGI’s overall active degree-seeking student body (includes both Aspen University and USU) grew 8% year-over-year to 14,318 as of October 31, 2021 from 13,238 as of October 31, 2020 and students seeking nursing degrees were 12,442 or 87% of total active students at both universities. Of the 12,442 students seeking nursing degrees, 9,942 are RNs studying to earn an advanced degree, including 7,031 at Aspen University and 2,911 at USU, while the remaining 2,500 nursing students are enrolled in Aspen University’s BSN Pre-Licensure program in the Phoenix, Austin, Tampa and Nashville metros.
The chart below shows five quarters of active student body results. Active student body is comprised of active degree-seeking students, enrolled in a course at the end of the second quarter of fiscal year 2022 or are registered for an upcoming course.
A chart accompanying this announcement is available at https://www.globenewswire.com/NewsRoom/AttachmentNg/63686639-7411-4cde-8cf5-c1457c44657e
Liquidity
At October 31, 2021, the Company had cash and cash equivalents of $11.0 million, and restricted cash of $1.4 million. Cash used in operations for the six months ended October 31, 2021 was $3.5 million, which is attributed to changes in working capital to support increased revenue.
On August 31, 2021, the Company drew down $5 million on the credit facility and extended the maturity by one year to November 4, 2022. These funds are expected to be used for general business purposes, including the roll out of the new campuses. The Company anticipates that the Aspen 2.0 business plan, to invest only in our highest LTV programs while continuing to control expenses, will reduce the need to borrow funds in the future.
Conference Call
Aspen Group, Inc. will host a conference call to discuss its second quarter fiscal 2022 results and business outlook on Tuesday, December 14, 2021, at 4:30 p.m. ET. Aspen Group, Inc. will issue a press release reporting results after the market closes on that day. The conference call can be accessed by dialing toll-free (844) 452-6823 (U.S.) or (731) 256-5216 (International), passcode 4291098.
Subsequent to the call, a transcript of the audio cast will be available from the Company’s website at www.aspu.com. There will also be a seven-day dial-in replay which can be accessed by dialing toll-free (855) 859-2056 (U.S.) or (404) 537-3406 (International), passcode 4291098.
For additional information on the financial statements and performance, please refer to the Aspen Group, Inc. Form 10-Q for the second quarter of fiscal year 2022 and Q2 2022 Financial Results Presentation published on the Company’s website at www.aspu.com, on the Presentations page under Company Info.
Non-GAAP – Financial Measures
This press release includes both financial measures in accordance with Generally Accepted Accounting Principles, or GAAP, as well as non-GAAP financial measures. Generally, a non-GAAP financial measure is a numerical measure of a company’s performance, financial position or cash flows that either excludes or includes amounts that are not normally included or excluded in the most directly comparable measure calculated and presented in accordance with GAAP. Non-GAAP financial measures should be viewed as supplemental to, and should not be considered as alternatives to net income (loss), operating income (loss), and cash flow from operating activities, liquidity or any other financial measures. They may not be indicative of the historical operating results of AGI nor are they intended to be predictive of potential future results. Investors should not consider non-GAAP financial measures in isolation or as substitutes for performance measures calculated in accordance with GAAP.
Our management uses and relies on EBITDA, Adjusted EBITDA and Adjusted EBITDA Margin, which are non-GAAP financial measures. We believe that management, analysts and shareholders benefit from referring to the following non-GAAP financial measures to evaluate and assess our core operating results from period-to-period after removing the impact of items that affect comparability. Our management recognizes that the non-GAAP financial measures have inherent limitations because of the excluded items described below.
We have included a reconciliation of our non-GAAP financial measures to the most comparable financial measures calculated in accordance with GAAP. We believe that providing the non-GAAP financial measures, together with the reconciliation to GAAP, helps investors make comparisons between AGI and other companies. In making any comparisons to other companies, investors need to be aware that companies use different non-GAAP measures to evaluate their financial performance. Investors should pay close attention to the specific definition being used and to the reconciliation between such measure and the corresponding GAAP measure provided by each company under applicable SEC rules.
AGI defines Adjusted EBITDA as EBITDA excluding: (1) bad debt expense; (2) stock-based compensation; and (3) non-recurring charges or gains. The following table presents a reconciliation of net loss to EBITDA and Adjusted EBITDA and of net loss margin to the Adjusted EBITDA margin:
| Three Months Ended October 31, | Six Months Ended October 31, | ||||||||||||||
| 2021 | 2020 | 2021 | 2020 | ||||||||||||
| Net loss | $ | (2,852,258 | ) | $ | (4,370,525 | ) | $ | (3,723,146 | ) | $ | (5,313,721 | ) | |||
| Interest expense, net | 138,064 | 1,529,517 | 170,196 | 1,984,740 | |||||||||||
| Taxes | 5,900 | 36,530 | 156,910 | 34,630 | |||||||||||
| Depreciation and amortization | 817,234 | 526,357 | 1,596,643 | 1,016,981 | |||||||||||
| EBITDA | (1,891,060 | ) | (2,278,121 | ) | (1,799,397 | ) | (2,277,370 | ) | |||||||
| Bad debt expense | 350,000 | 632,000 | 700,000 | 1,032,000 | |||||||||||
| Stock-based compensation | 722,158 | 1,831,548 | 1,264,870 | 2,318,658 | |||||||||||
| Non-recurring charges - Severance | — | — | 19,665 | 44,000 | |||||||||||
| Non-recurring (income) charges - Other | 103,754 | — | (394,366 | ) | 375,437 | ||||||||||
| Adjusted EBITDA | $ | (715,148 | ) | $ | 185,427 | $ | (209,228 | ) | $ | 1,492,725 | |||||
| Net loss Margin | (15 | )% | (26 | )% | (10 | )% | (17 | )% | |||||||
| Adjusted EBITDA Margin | (4 | )% | 1 | % | (1 | )% | 5 | % | |||||||
The following tables present a reconciliation of net loss to EBITDA and Adjusted EBITDA and of net income (loss) margin to the Adjusted EBITDA margin by subsidiary:
| Three Months Ended October 31, 2021 | |||||||||||||||
| Consolidated | AGI Corporate | AU | USU | ||||||||||||
| Net income (loss) | $ | (2,852,258 | ) | $ | (5,059,164 | ) | $ | 1,329,813 | $ | 877,093 | |||||
| Interest expense, net | 138,064 | 139,239 | (739 | ) | (436 | ) | |||||||||
| Taxes | 5,900 | 1,249 | 3,400 | 1,251 | |||||||||||
| Depreciation and amortization | 817,234 | 38,141 | 681,107 | 97,986 | |||||||||||
| EBITDA | (1,891,060 | ) | (4,880,535 | ) | 2,013,581 | 975,894 | |||||||||
| Bad debt expense | 350,000 | — | 250,000 | 100,000 | |||||||||||
| Stock-based compensation | 722,158 | 672,967 | 23,298 | 25,893 | |||||||||||
| Non-recurring charges - Severance | — | — | — | — | |||||||||||
| Non-recurring income - Other | 103,754 | 58,325 | 45,429 | — | |||||||||||
| Adjusted EBITDA | $ | (715,148 | ) | $ | (4,149,243 | ) | $ | 2,332,308 | $ | 1,101,787 | |||||
| Net income (loss) Margin | (15 | )% | NM | 10 | % | 14 | % | ||||||||
| Adjusted EBITDA Margin | (4 | )% | NM | 18 | % | 18 | % | ||||||||
________________________________
NM - Not meaningful
| Three Months Ended October 31, 2020 | |||||||||||||||
| Consolidated | AGI Corporate | AU | USU | ||||||||||||
| Net income (loss) | $ | (4,370,525 | ) | $ | (7,136,251 | ) | $ | 2,207,770 | $ | 557,956 | |||||
| Interest expense, net | 1,529,517 | 1,529,519 | — | (2 | ) | ||||||||||
| Taxes | 36,530 | 12,550 | 23,780 | 200 | |||||||||||
| Depreciation and amortization | 526,357 | 13,391 | 481,673 | 31,293 | |||||||||||
| EBITDA | (2,278,121 | ) | (5,580,791 | ) | 2,713,223 | 589,447 | |||||||||
| Bad debt expense | 632,000 | — | 572,000 | 60,000 | |||||||||||
| Stock-based compensation | 1,831,548 | 1,684,400 | 86,317 | 60,831 | |||||||||||
| Non-recurring charges - Severance | — | — | — | — | |||||||||||
| Non-recurring charges - Other | — | — | — | — | |||||||||||
| Adjusted EBITDA | $ | 185,427 | $ | (3,896,391 | ) | $ | 3,371,540 | $ | 710,278 | ||||||
| Net income (loss) Margin | (26 | )% | NM | 18 | % | 11 | % | ||||||||
| Adjusted EBITDA Margin | 1 | % | NM | 28 | % | 14 | % | ||||||||
| Six Months Ended October 31, 2021 | |||||||||||||||
| Consolidated | AGI Corporate | AU | USU | ||||||||||||
| Net income (loss) | $ | (3,723,146 | ) | $ | (9,517,700 | ) | $ | 3,664,270 | $ | 2,130,284 | |||||
| Interest expense, net | 170,196 | 172,511 | (1,739 | ) | (576 | ) | |||||||||
| Taxes | 156,910 | 2,412 | 153,207 | 1,291 | |||||||||||
| Depreciation and amortization | 1,596,643 | 69,184 | 1,344,800 | 182,659 | |||||||||||
| EBITDA | (1,799,397 | ) | (9,273,593 | ) | 5,160,538 | 2,313,658 | |||||||||
| Bad debt expense | 700,000 | — | 500,000 | 200,000 | |||||||||||
| Stock-based compensation | 1,264,870 | 1,116,246 | 92,893 | 55,731 | |||||||||||
| Non-recurring charges - Severance | 19,665 | — | — | 19,665 | |||||||||||
| Non-recurring income - Other | (394,366 | ) | 58,325 | (452,691 | ) | — | |||||||||
| Adjusted EBITDA | $ | (209,228 | ) | $ | (8,099,022 | ) | $ | 5,300,740 | $ | 2,589,054 | |||||
| Net income (loss) Margin | (10 | )% | NM | 14 | % | 17 | % | ||||||||
| Adjusted EBITDA Margin | (1 | )% | NM | 20 | % | 21 | % | ||||||||
| Six Months Ended October 31, 2020 | |||||||||||||||
| Consolidated | AGI Corporate | AU | USU | ||||||||||||
| Net income (loss) | $ | (5,313,721 | ) | $ | (11,391,986 | ) | $ | 4,517,533 | $ | 1,560,732 | |||||
| Interest expense, net | 1,984,740 | 1,984,742 | — | (2 | ) | ||||||||||
| Taxes | 34,630 | 10,650 | 23,780 | 200 | |||||||||||
| Depreciation and amortization | 1,016,981 | 26,483 | 931,727 | 58,771 | |||||||||||
| EBITDA | (2,277,370 | ) | (9,370,111 | ) | 5,473,040 | 1,619,701 | |||||||||
| Bad debt expense | 1,032,000 | — | 912,000 | 120,000 | |||||||||||
| Stock-based compensation | 2,318,658 | 2,076,443 | 147,634 | 94,581 | |||||||||||
| Non-recurring charges - Severance | 44,000 | 44,000 | — | — | |||||||||||
| Non-recurring charges - Other | 375,437 | 375,437 | — | — | |||||||||||
| Adjusted EBITDA | $ | 1,492,725 | $ | (6,874,231 | ) | $ | 6,532,674 | $ | 1,834,282 | ||||||
| Net income (loss) Margin | (17 | )% | NM | 20 | % | 17 | % | ||||||||
| Adjusted EBITDA Margin | 5 | % | NM | 29 | % | 20 | % | ||||||||
In Full Fiscal Q2 2022, the non-recurring income of $498,120 is from a litigation settlement, which is included in “other income (expense), net.” In Full Fiscal Q2 2021, an additional non-recurring charge of $25,966 was included in “interest expense, net”, which arose from the acceleration of amortization resulting from the exercise of warrants issued to a lender.
Definitions
Lifetime Value ("LTV") – is calculated as the weighted average total amount of tuition and fees paid by every new student that enrolls in the Company’s universities, after giving effect to attrition.
Bookings – is defined by multiplying LTV by new student enrollments for each operating unit.
Adjusted EBITDA Margin – is defined as Adjusted EBITDA divided by revenue. We believe Adjusted EBITDA margin is useful for management, analysts and investors as this measure allows for a more meaningful comparison between our performance and that of our competitors. Adjusted EBITDA margin has certain limitations in that it does not take into account the impact to our consolidated statement of operations of certain expenses.
Forward-Looking Statements
This press release contains forward-looking statements within the meaning of the Private Securities Litigation Reform Act of 1995 including revenue growth, the growth of the pre-licensure and FNP programs, post COVID-19 pre-licensure campus expansions, the effect of COVID-19 on the second half of fiscal 2022, G&A spending, the Aspen 2.0 business plan and anticipated reduction in the need to borrow funds, our liquidity, and our estimates as to Lifetime Value and bookings. The words “believe,” “may,” “estimate,” “continue,” “anticipate,” “intend,” “should,” “plan,” “could,” “target,” “potential,” “is likely,” “will,” “expect” and similar expressions, as they relate to us, are intended to identify forward-looking statements. We have based these forward-looking statements largely on our current expectations and projections about future events and financial trends that we believe may affect our financial condition, results of operations, business strategy and financial needs. Important factors that could cause actual results to differ from those in the forward-looking statements include our ability to successfully implement the Aspen 2.0 business plan, the continued demand of nursing students, the effectiveness of our collection efforts and process improvements, student attrition, national and local economic factors including the substantial impact of the COVID-19 pandemic on working nurses and the economy, competition from nursing schools in local markets, the competitive impact from the trend of major non-profit universities using online education and consolidation among our competitors, unfavorable regulatory changes, the continued effectiveness of our marketing efforts, and potential loss of employees as a result of the COVID-19 vaccine mandate. Other risks are included in our filings with the SEC including our Form 10-K for the year ended April 30, 2021, and the Form 10-Q for the fiscal quarter ended October 31, 2021. Any forward-looking statement made by us herein speaks only as of the date on which it is made. Factors or events that could cause our actual results to differ may emerge from time to time, and it is not possible for us to predict all of them. We undertake no obligation to publicly update any forward-looking statement, whether as a result of new information, future developments or otherwise, except as may be required by law.
About Aspen Group, Inc.
Aspen Group, Inc. is an education technology holding company that leverages its infrastructure and expertise to allow its two universities, Aspen University and United States University, to deliver on the vision of making college affordable again.
Investor Relations Contact
Kim Rogers
Managing Director
Hayden IR
385-831-7337
Kim@HaydenIR.com
GAAP Financial Statements
|
ASPEN GROUP, INC. AND SUBSIDIARIES CONSOLIDATED BALANCE SHEETS | |||||||
| October 31, 2021 | April 30, 2021 | ||||||
| (Unaudited) | |||||||
| Assets | |||||||
| Current assets: | |||||||
| Cash and cash equivalents | $ | 10,985,131 | $ | 12,472,082 | |||
| Restricted cash | 1,433,397 | 1,193,997 | |||||
| Accounts receivable, net of allowance of $3,345,182 and $3,289,816, respectively | 21,309,982 | 16,724,744 | |||||
| Prepaid expenses | 1,577,516 | 1,077,831 | |||||
| Other current assets | 20,631 | 68,529 | |||||
| Total current assets | 35,326,657 | 31,537,183 | |||||
| Property and equipment: | |||||||
| Computer equipment and hardware | 1,402,006 | 956,463 | |||||
| Furniture and fixtures | 1,976,342 | 1,705,101 | |||||
| Leasehold improvements | 7,057,859 | 5,729,324 | |||||
| Instructional equipment | 608,894 | 421,039 | |||||
| Software | 9,386,352 | 8,488,635 | |||||
| Construction in progress | 900 | 247,767 | |||||
| 20,432,353 | 17,548,329 | ||||||
| Less: accumulated depreciation and amortization | (6,672,208 | ) | (4,892,987 | ) | |||
| Total property and equipment, net | 13,760,145 | 12,655,342 | |||||
| Goodwill | 5,011,432 | 5,011,432 | |||||
| Intangible assets, net | 7,907,503 | 7,908,360 | |||||
| Courseware, net | 299,914 | 187,296 | |||||
| Accounts receivable, net of allowance of $— and $625,963, respectively | — | 45,329 | |||||
| Long-term contractual accounts receivable | 12,663,815 | 10,249,833 | |||||
| Deferred financing costs | 117,857 | 18,056 | |||||
| Operating lease right of use assets, net | 13,510,656 | 12,714,863 | |||||
| Deposits and other assets | 515,569 | 479,212 | |||||
| Total assets | $ | 89,113,548 | $ | 80,806,906 | |||
|
ASPEN GROUP, INC. AND SUBSIDIARIES CONSOLIDATED BALANCE SHEETS (CONTINUED) | |||||||
| October 31, 2021 | April 30, 2021 | ||||||
| (Unaudited) | |||||||
| Liabilities and Stockholders’ Equity | |||||||
| Liabilities: | |||||||
| Current liabilities: | |||||||
| Accounts payable | $ | 2,102,624 | $ | 1,466,488 | |||
| Accrued expenses | 1,772,808 | 2,040,896 | |||||
| Deferred revenue | 10,191,241 | 6,825,014 | |||||
| Due to students | 3,219,643 | 2,747,484 | |||||
| Operating lease obligations, current portion | 2,145,431 | 2,029,821 | |||||
| Other current liabilities | 96,003 | 307,921 | |||||
| Total current liabilities | 19,527,750 | 15,417,624 | |||||
| Long-term debt | 5,000,000 | — | |||||
| Operating lease obligations, less current portion | 17,732,483 | 16,298,808 | |||||
| Total liabilities | 42,260,233 | 31,716,432 | |||||
| Commitments and contingencies | |||||||
| Stockholders’ equity: | |||||||
| Preferred stock, $0.001 par value; 1,000,000 shares authorized, | |||||||
| 0 issued and 0 outstanding at October 31, 2021 and April 30, 2021 | — | — | |||||
| Common stock, $0.001 par value; 40,000,000 shares authorized, | |||||||
| 25,148,194 issued and 24,992,708 outstanding at October 31, 2021 | |||||||
| 25,066,297 issued and 24,910,811 outstanding at April 30, 2021 | 25,149 | 25,067 | |||||
| Additional paid-in capital | 110,526,729 | 109,040,824 | |||||
| Treasury stock (155,486 at both October 31, 2021 and April 30, 2021) | (1,817,414 | ) | (1,817,414 | ) | |||
| Accumulated deficit | (61,881,149 | ) | (58,158,003 | ) | |||
| Total stockholders’ equity | 46,853,315 | 49,090,474 | |||||
| Total liabilities and stockholders’ equity | $ | 89,113,548 | $ | 80,806,906 | |||
|
ASPEN GROUP, INC. AND SUBSIDIARIES CONSOLIDATED STATEMENTS OF OPERATIONS (Unaudited) | |||||||||||||||
| Three Months Ended October 31, | Six Months Ended October 31, | ||||||||||||||
| 2021 | 2020 | 2021 | 2020 | ||||||||||||
| Revenue | $ | 18,940,211 | $ | 16,971,045 | $ | 38,371,206 | $ | 32,136,607 | |||||||
| Operating expenses: | |||||||||||||||
| Cost of revenue (exclusive of depreciation and amortization shown separately below) | 8,789,201 | 7,324,780 | 17,382,769 | 13,172,303 | |||||||||||
| General and administrative | 11,641,312 | 11,285,155 | 22,587,789 | 20,078,911 | |||||||||||
| Bad debt expense | 350,000 | 632,000 | 700,000 | 1,032,000 | |||||||||||
| Depreciation and amortization | 817,234 | 526,357 | 1,596,643 | 1,016,981 | |||||||||||
| Total operating expenses | 21,597,747 | 19,768,292 | 42,267,201 | 35,300,195 | |||||||||||
| Operating loss | (2,657,536 | ) | (2,797,247 | ) | (3,895,995 | ) | (3,163,588 | ) | |||||||
| Other income (expense): | |||||||||||||||
| Interest expense | (139,502 | ) | (1,529,668 | ) | (173,041 | ) | (1,985,125 | ) | |||||||
| Other (expense) income, net | (49,320 | ) | (7,080 | ) | 502,800 | (130,378 | ) | ||||||||
| Total other (expense) income, net | (188,822 | ) | (1,536,748 | ) | 329,759 | (2,115,503 | ) | ||||||||
| Loss before income taxes | (2,846,358 | ) | (4,333,995 | ) | (3,566,236 | ) | (5,279,091 | ) | |||||||
| Income tax expense | 5,900 | 36,530 | 156,910 | 34,630 | |||||||||||
| Net loss | $ | (2,852,258 | ) | $ | (4,370,525 | ) | $ | (3,723,146 | ) | $ | (5,313,721 | ) | |||
| Net loss per share - basic and diluted | $ | (0.11 | ) | $ | (0.19 | ) | $ | (0.15 | ) | $ | (0.23 | ) | |||
| Weighted average number of common stock outstanding - basic and diluted | 24,957,046 | 22,791,503 | 24,935,793 | 22,763,235 | |||||||||||
|
ASPEN GROUP, INC. AND SUBSIDIARIES CONSOLIDATED STATEMENTS OF CHANGES IN STOCKHOLDERS’ EQUITY Three Months Ended October 31, 2021 and 2020 (Unaudited) | ||||||||||||||||||||||
| Common Stock |
Additional Paid-In Capital |
Treasury Stock |
Accumulated Deficit |
Total Stockholders’ Equity |
||||||||||||||||||
| Shares | Amount | |||||||||||||||||||||
| Balance at July 31, 2021 | 25,087,051 | $ | 25,088 | $ | 109,617,521 | $ | (1,817,414 | ) | $ | (59,028,891 | ) | $ | 48,796,304 | |||||||||
| Stock-based compensation | — | — | 722,158 | — | — | 722,158 | ||||||||||||||||
| Common stock issued for stock options exercised for cash | 11,655 | 12 | 33,474 | — | — | 33,486 | ||||||||||||||||
| Common stock issued for cashless stock options exercised | 30,156 | 30 | (30 | ) | — | — | — | |||||||||||||||
| Common stock issued for vested restricted stock units | 19,332 | 19 | (19 | ) | — | — | — | |||||||||||||||
| Amortization of warrant based cost | — | — | 16,125 | — | — | 16,125 | ||||||||||||||||
| Warrants issued for deferred financing costs related to Credit Facility | — | — | 137,500 | — | — | 137,500 | ||||||||||||||||
| Net loss | — | — | — | — | (2,852,258 | ) | (2,852,258 | ) | ||||||||||||||
| Balance at October 31, 2021 | 25,148,194 | $ | 25,149 | $ | 110,526,729 | $ | (1,817,414 | ) | $ | (61,881,149 | ) | $ | 46,853,315 | |||||||||
| Common Stock |
Additional Paid-In Capital |
Treasury Stock |
Accumulated Deficit |
Total Stockholders’ Equity |
||||||||||||||||||
| Shares | Amount | |||||||||||||||||||||
| Balance at July 31, 2020 | 22,377,744 | $ | 22,378 | $ | 92,378,584 | $ | (70,000 | ) | $ | (48,652,226 | ) | $ | 43,678,736 | |||||||||
| Stock-based compensation | — | — | 1,831,548 | — | — | 1,831,548 | ||||||||||||||||
| Common stock issued for stock options exercised for cash | 502,412 | 502 | 944,830 | — | — | 945,332 | ||||||||||||||||
| Common stock issued for cashless stock options exercised | 22,339 | 22 | (22 | ) | — | — | — | |||||||||||||||
| Common stock issued for conversion of Convertible Notes | 1,398,602 | 1,399 | 9,998,601 | — | — | 10,000,000 | ||||||||||||||||
| Common stock issued for vested restricted stock units | 132,109 | 132 | (132 | ) | — | — | — | |||||||||||||||
| Amortization of warrant based cost | — | — | 9,125 | — | — | 9,125 | ||||||||||||||||
| Cancellation of Treasury Stock | (16,667 | ) | (17 | ) | (69,983 | ) | 70,000 | — | — | |||||||||||||
| Net loss | — | — | — | — | (4,370,525 | ) | (4,370,525 | ) | ||||||||||||||
| Balance at October 31, 2020 | 24,416,539 | $ | 24,416 | $ | 105,092,551 | $ | — | $ | (53,022,751 | ) | $ | 52,094,216 | ||||||||||
|
ASPEN GROUP, INC. AND SUBSIDIARIES CONSOLIDATED STATEMENTS OF CHANGES IN STOCKHOLDERS’ EQUITY (CONTINUED) Six Months Ended October 31, 2021 and 2020 (Unaudited) | ||||||||||||||||||||||
| Common Stock |
Additional Paid-In Capital |
Treasury Stock |
Accumulated Deficit |
Total Stockholders’ Equity |
||||||||||||||||||
| Shares | Amount | |||||||||||||||||||||
| Balance at April 30, 2021 | 25,066,297 | $ | 25,067 | $ | 109,040,824 | $ | (1,817,414 | ) | $ | (58,158,003 | ) | $ | 49,090,474 | |||||||||
| Stock-based compensation | — | — | 1,264,870 | — | — | 1,264,870 | ||||||||||||||||
| Common stock issued for stock options exercised for cash | 16,752 | 17 | 56,017 | — | — | 56,034 | ||||||||||||||||
| Common stock issued for cashless stock options exercised | 30,156 | 30 | (30 | ) | — | — | — | |||||||||||||||
| Common stock issued for vested restricted stock units | 34,989 | 35 | (35 | ) | — | — | — | |||||||||||||||
| Amortization of warrant based cost | — | — | 27,583 | — | — | 27,583 | ||||||||||||||||
| Warrants issued for deferred financing costs related to Credit Facility | — | — | 137,500 | — | — | 137,500 | ||||||||||||||||
| Net loss | — | — | — | — | (3,723,146 | ) | (3,723,146 | ) | ||||||||||||||
| Balance at October 31, 2021 | 25,148,194 | $ | 25,149 | $ | 110,526,729 | $ | (1,817,414 | ) | $ | (61,881,149 | ) | $ | 46,853,315 | |||||||||
| Common Stock |
Additional Paid-In Capital |
Treasury Stock |
Accumulated Deficit |
Total Stockholders’ Equity |
||||||||||||||||||
| Shares | Amount | |||||||||||||||||||||
| Balance at April 30, 2020 | 21,770,520 | $ | 21,771 | $ | 89,505,216 | $ | (70,000 | ) | $ | (47,709,030 | ) | $ | 41,747,957 | |||||||||
| Stock-based compensation | — | — | 2,318,658 | — | — | 2,318,658 | ||||||||||||||||
| Common stock issued for stock options exercised for cash | 917,587 | 918 | 2,214,397 | — | — | 2,215,315 | ||||||||||||||||
| Common stock issued for cashless stock options exercised | 22,339 | 22 | (22 | ) | — | — | — | |||||||||||||||
| Common stock issued for conversion of Convertible Notes | 1,398,602 | 1,399 | 9,998,601 | — | — | 10,000,000 | ||||||||||||||||
| Common stock issued for vested restricted stock units | 132,109 | 132 | (132 | ) | — | — | — | |||||||||||||||
| Common stock issued for warrants exercised for cash | 192,049 | 191 | 1,081,600 | — | — | 1,081,791 | ||||||||||||||||
| Modification charge for warrants exercised | — | — | 25,966 | — | — | 25,966 | ||||||||||||||||
| Amortization of warrant based cost | — | — | 18,250 | — | — | 18,250 | ||||||||||||||||
| Cancellation of Treasury Stock | (16,667 | ) | (17 | ) | (69,983 | ) | 70,000 | — | — | |||||||||||||
| Net loss | — | — | — | — | (5,313,721 | ) | (5,313,721 | ) | ||||||||||||||
| Balance at October 31, 2020 | 24,416,539 | $ | 24,416 | $ | 105,092,551 | $ | — | $ | (53,022,751 | ) | $ | 52,094,216 | ||||||||||
|
ASPEN GROUP, INC. AND SUBSIDIARIES CONSOLIDATED STATEMENTS OF CASH FLOWS (Unaudited) | |||||||
| Six Months Ended October 31, | |||||||
| 2021 | 2020 | ||||||
| Cash flows from operating activities: | |||||||
| Net loss | $ | (3,723,146 | ) | $ | (5,313,721 | ) | |
| Adjustments to reconcile net loss to net cash used in operating activities: | |||||||
| Bad debt expense | 700,000 | 1,032,000 | |||||
| Depreciation and amortization | 1,596,643 | 1,016,981 | |||||
| Stock-based compensation | 1,264,870 | 2,318,658 | |||||
| Amortization of warrant based cost | 27,583 | 18,250 | |||||
| Amortization of debt discounts | — | 1,550,854 | |||||
| Amortization of debt issue costs | 18,056 | 147,695 | |||||
| Amortization of deferred financing costs | 19,643 | — | |||||
| Modification charge for warrants exercised | — | 25,966 | |||||
| Loss on asset disposition | 36,442 | — | |||||
| Lease benefit | (63,099 | ) | — | ||||
| Tenant improvement allowances received from landlords | 816,591 | — | |||||
| Changes in operating assets and liabilities: | |||||||
| Accounts receivable | (7,699,220 | ) | (8,246,180 | ) | |||
| Prepaid expenses | (520,685 | ) | (654,268 | ) | |||
| Other receivables | — | 23,097 | |||||
| Other current assets | 47,901 | (273,767 | ) | ||||
| Accounts receivable, other | 45,329 | — | |||||
| Deposits and other assets | (15,357 | ) | (171,303 | ) | |||
| Accounts payable | 636,136 | 838,421 | |||||
| Accrued expenses | (268,088 | ) | 1,282,983 | ||||
| Due to students | 472,159 | (301,619 | ) | ||||
| Deferred revenue | 3,366,227 | 4,915,504 | |||||
| Other current liabilities | (211,918 | ) | (286,372 | ) | |||
| Net cash used in operating activities | (3,453,933 | ) | (2,076,821 | ) | |||
| Cash flows from investing activities: | |||||||
| Purchases of courseware and accreditation | (149,751 | ) | (11,375 | ) | |||
| Purchases of property and equipment | (2,699,901 | ) | (2,233,348 | ) | |||
| Net cash used in investing activities | (2,849,652 | ) | (2,244,723 | ) | |||
| Cash flows from financing activities: | |||||||
| Borrowings under the Credit Facility | 5,000,000 | — | |||||
| Proceeds from stock options exercised | 56,034 | 2,215,315 | |||||
| Proceeds from warrants exercised | — | 1,081,792 | |||||
| Net cash provided by financing activities | 5,056,034 | 3,297,107 | |||||
|
ASPEN GROUP, INC. AND SUBSIDIARIES CONSOLIDATED STATEMENTS OF CASH FLOWS (CONTINUED) (Unaudited) | |||||||
| Six Months Ended October 31, | |||||||
| 2021 | 2020 | ||||||
| Net decrease in cash, cash equivalents and restricted cash | $ | (1,247,551 | ) | $ | (1,024,437 | ) | |
| Cash, cash equivalents and restricted cash at beginning of period | 13,666,079 | 17,906,765 | |||||
| Cash, cash equivalents and restricted cash at end of period | $ | 12,418,528 | $ | 16,882,328 | |||
| Supplemental disclosure cash flow information: | |||||||
| Cash paid for interest | $ | 98,904 | $ | 285,749 | |||
| Cash paid for income taxes | $ | 157,552 | $ | 38,608 | |||
| Supplemental disclosure of non-cash investing and financing activities: | |||||||
| Common stock issued for conversion of Convertible Notes | $ | — | $ | 10,000,000 | |||
| Warrants issued as part of Credit Facility | $ | 137,500 | $ | — | |||
The following table provides a reconciliation of cash and cash equivalents and restricted cash reported within the accompanying consolidated balance sheet to the total amounts shown in the accompanying unaudited consolidated statements of cash flows:
| October 31, 2021 | April 30, 2021 | ||||||
| Cash and cash equivalents | $ | 10,985,131 | $ | 12,472,082 | |||
| Restricted cash | 1,433,397 | 1,193,997 | |||||
| Total cash, cash equivalents and restricted cash | $ | 12,418,528 | $ | 13,666,079 | |||

![]()
AU and USU Active Student Body
AU and USU Active Student Body
Released December 14, 2021